Hi! I'm trying to merge subjects from a dataframe that have the same number on a column.
> ID CONSENTIMIENTO EDAD GENERO    FECHA.NAC     JPC_VI_GRUPO JPC_VI_COND JPC_VI_COLOR JPC_VI_DECISION1 JPC_VI_DECISION2
> 1   1              1   11      2 30/05/2006           11           D            N                1                0
> 2   7              1   43      1 10/03/1974           11           D            V                3                3
> 3   3              1   11      2 24/05/2006           33           D         <NA>                4                5
> 4   6              1   41      2 05/08/1976           33           D         <NA>                4                4
> 5   8              1    5      1 28/04/2012            1           D            V                1                2
> 6  11              1   38      1 27/07/1979            1           D            N                3                3
> 7   9              1    8      2 08/05/2009           18           D            V                1                3
> 8  10              1   36      2 24/06/1981           18           D            N                3                4
> 9  16              1    8      1 03/02/2009           19           D            V                1                0
> 10 17              1   36      2 12/05/1981           19           D            N                2                4
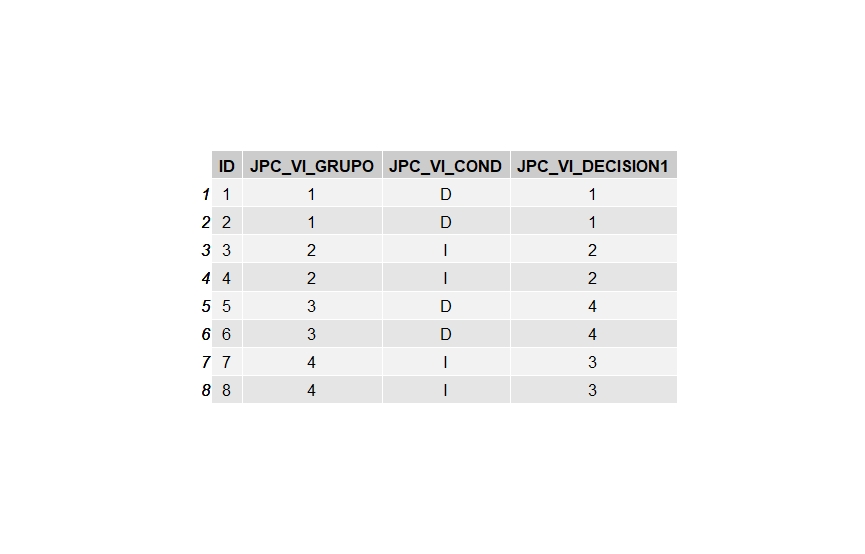
in this case i need to merge rows that have the same JPC_VI_GRUPO number to make a grid.table with JPC_VI_COND and JPC_VI_DECISION1
> grid.table(table(var_datosgrupal$JPC_VI_COND,var_datosgrupal$JPG_VG_VINCULO))
Here i have the total amount of subjects but i want to make a grid using only the peer that have the same group number.
How could i get this done?
i used grid.table to represent the data for every subject in my original df but now i need to use JPC_VI_GRUPO. > grid.table(table(var_datosgrupal$JPC_VI_COND,var_datosgrupal$JPG_VG_VINCULO))
Hope this is a reproducible example
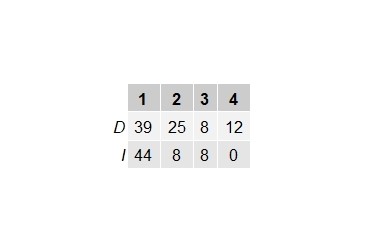
What i want is to show how many dyads of "D" and "I" conditions have responded 1, 2, 3 or 4 in decision.
So if my n was 8 (because i had 8 subjects) now my n should be 4 (because they where in peer).
i think my point is that i need some code to merge the 2 rows (i.e. 1 and 2) that represent the same group so i can count how many groups i have that meet JPC_VI_COND and JPC_VI_DECISION1