How to manually add keys to my plot

Hey there, how are you!! Thanks for looking into my problem.

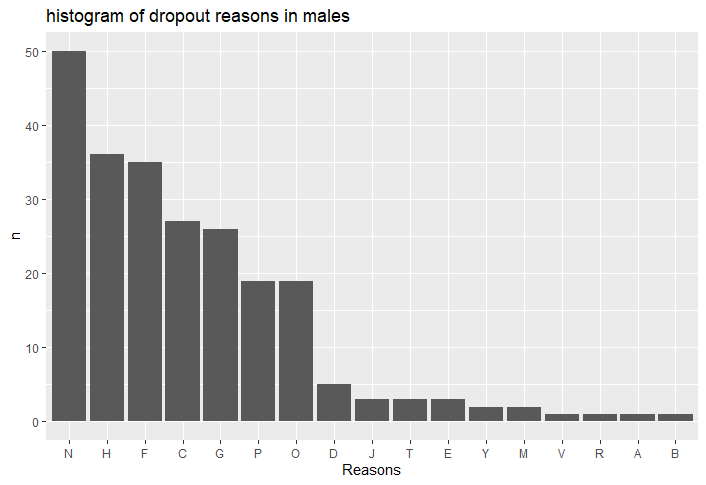
Given below is a subset of the data in dput format and the related graph. How can I manually add keys of the first four bars in the plot.

structure(list(hstate = structure(c(10, 10, 10, 10, 10, 10, 10, 
10, 10, 10, 10, 10, 10, 10, 10, 10, 10, 10, 10, 10, 10, 10, 10, 
10, 10, 10, 10, 10, 10, 10, 10, 10, 10, 10, 10, 10, 10, 10, 10, 
10, 10, 10, 10, 10, 10, 10, 10, 10, 10, 10), labels = c(`Uttar Pradesh` = 9, 
Bihar = 10), label = "state number", class = c("haven_labelled", 
"vctrs_vctr", "double")), Comhpsu = structure(c(152, 155, 156, 
163, 166, 168, 168, 168, 177, 182, 185, 185, 186, 187, 188, 189, 
189, 189, 189, 189, 191, 192, 192, 193, 194, 194, 203, 209, 211, 
213, 214, 214, 214, 214, 217, 217, 219, 220, 221, 223, 225, 229, 
229, 231, 231, 233, 234, 237, 239, 241), label = "group(hstate hpsu)", format.stata = "%9.0g"), 
    hpsu = structure(c(2, 5, 6, 13, 16, 18, 18, 18, 27, 32, 35, 
    35, 36, 37, 38, 39, 39, 39, 39, 39, 41, 42, 42, 43, 44, 44, 
    53, 59, 61, 63, 64, 64, 64, 64, 67, 67, 69, 70, 71, 73, 75, 
    79, 79, 81, 81, 83, 84, 87, 89, 91), label = "psu number", format.stata = "%8.0g"), 
    hhno = structure(c(136, 108, 288, 341, 302, 72, 96, 98, 99, 
    61, 343, 360, 46, 336, 22, 4, 144, 159, 273, 322, 217, 258, 
    444, 309, 338, 401, 342, 391, 358, 277, 244, 341, 348, 352, 
    416, 427, 28, 481, 314, 284, 92, 96, 173, 365, 607, 186, 
    596, 293, 201, 432), label = "household number", format.stata = "%8.0g"), 
    gg08 = structure(c(3, 3, 5, 3, 4, 3, 8, 3, 3, 4, 7, 6, 5, 
    5, 4, 8, 5, 4, 3, 2, 7, 4, 3, 5, 5, 4, 4, 6, 5, 5, 12, 4, 
    5, 3, 4, 3, 13, 6, 3, 4, 3, 2, 4, 3, 3, 5, 5, 6, 4, 4), label = "line number of respondent", format.stata = "%8.0g"), 
    gg114 = structure(c("HN", "H", "N", "CF", "F", "H", "", "F", 
    "JV", "", "FG", "N", "C", "GT", "P", "CN", "H", "F", "C", 
    "DFG", "F", "GH", "", "G", "", "", "G", "G", "", "P", "G", 
    "", "N", "FP", "CN", "G", "", "F", "", "", "O", "N", "Y", 
    "N", "CN", "C", "N", "H", "", "JN"), label = "reasons for discontinuing school/never attended school", format.stata = "%23s"), 
    gg101b = structure(c(16, 19, 17, 17, 17, 19, 18, 17, 14, 
    18, 18, 16, 19, 18, 17, 17, 19, 17, 19, 19, 18, 18, 17, 18, 
    18, 18, 16, 18, 18, 17, 17, 18, 16, 17, 19, 19, 18, 19, 19, 
    19, 19, 18, 18, 17, 19, 16, 19, 19, 18, 18), label = "age in completed years", format.stata = "%8.0g"), 
    gg105 = structure(c(10, 10, 9, 9, 10, 9, 12, 9, 9, 12, 9, 
    9, 9, 9, 9, 10, 9, 9, 10, 10, 9, 10, 12, 10, 12, 12, 9, 10, 
    12, 10, 9, 12, 9, 9, 10, 9, 12, 9, 12, 12, 9, 9, 9, 9, 9, 
    9, 9, 9, 12, 9), labels = c(`Never attended school/attended only a religious school` = 95), label = "completed years of schooling", class = c("haven_labelled", 
    "vctrs_vctr", "double")), rcat = structure(c(2, 2, 2, 2, 
    2, 2, 2, 2, 1, 2, 2, 2, 2, 2, 2, 2, 2, 2, 2, 2, 2, 2, 2, 
    2, 2, 2, 2, 2, 2, 2, 2, 2, 2, 2, 2, 2, 2, 2, 2, 2, 2, 2, 
    2, 2, 2, 2, 2, 2, 2, 2), labels = c(`UM10-14` = 1, `UM15-19` = 2, 
    `UF10-14` = 3, `UF15-19` = 4, `MF15-19` = 5), label = "respondent category", class = c("haven_labelled", 
    "vctrs_vctr", "double"))), row.names = c(NA, -50L), class = c("tbl_df", 
"tbl", "data.frame"))

Could you say a little more? I'm not sure what you mean by a "key" that can be added.

ggplot()+
  geom_bar(
    data = df, 
    aes(
      # rearrange x by count
      x = forcats::fct_infreq(gg114),
      # assign fill to the first four levels of gg114
      fill = ifelse(gg114 %in% levels(fct_infreq(gg114))[1:4], gg114, "other"), 
      ),
    stat = "count"
) + 
  scale_fill_manual(
    values = c("#ffa700", "#0A5ECC", "#B3097A", "#1DB309", "grey"), 
    breaks = c(levels(fct_infreq(df$gg114))[1:4], "other"),
    na.value = "grey"
    )+
  labs (x = "gg114")+
  guides(fill = guide_legend(
    title = "reasons",
    ))

@dromano by 'keys' I mean legends. So each of those letters in the plot mean something, I just want to add manually legends for the first four, stating what they mean.

@mduvekot The code is giving an error as: 'Error in df$gg114 : object of type 'closure' is not subsettable'

You dataframe is probably not called df, so df$gg114 does not exist. Use the name of your dayaframe instead.

If this sort of what you mean, then?

sample data, saved as `toy_df`
toy_df <- 
structure(list(hstate = structure(c(10, 10, 10, 10, 10, 10, 10, 
10, 10, 10, 10, 10, 10, 10, 10, 10, 10, 10, 10, 10, 10, 10, 10, 
10, 10, 10, 10, 10, 10, 10, 10, 10, 10, 10, 10, 10, 10, 10, 10, 
10, 10, 10, 10, 10, 10, 10, 10, 10, 10, 10), labels = c(`Uttar Pradesh` = 9, 
Bihar = 10), label = "state number", class = c("haven_labelled", 
"vctrs_vctr", "double")), Comhpsu = structure(c(152, 155, 156, 
163, 166, 168, 168, 168, 177, 182, 185, 185, 186, 187, 188, 189, 
189, 189, 189, 189, 191, 192, 192, 193, 194, 194, 203, 209, 211, 
213, 214, 214, 214, 214, 217, 217, 219, 220, 221, 223, 225, 229, 
229, 231, 231, 233, 234, 237, 239, 241), label = "group(hstate hpsu)", format.stata = "%9.0g"), 
    hpsu = structure(c(2, 5, 6, 13, 16, 18, 18, 18, 27, 32, 35, 
    35, 36, 37, 38, 39, 39, 39, 39, 39, 41, 42, 42, 43, 44, 44, 
    53, 59, 61, 63, 64, 64, 64, 64, 67, 67, 69, 70, 71, 73, 75, 
    79, 79, 81, 81, 83, 84, 87, 89, 91), label = "psu number", format.stata = "%8.0g"), 
    hhno = structure(c(136, 108, 288, 341, 302, 72, 96, 98, 99, 
    61, 343, 360, 46, 336, 22, 4, 144, 159, 273, 322, 217, 258, 
    444, 309, 338, 401, 342, 391, 358, 277, 244, 341, 348, 352, 
    416, 427, 28, 481, 314, 284, 92, 96, 173, 365, 607, 186, 
    596, 293, 201, 432), label = "household number", format.stata = "%8.0g"), 
    gg08 = structure(c(3, 3, 5, 3, 4, 3, 8, 3, 3, 4, 7, 6, 5, 
    5, 4, 8, 5, 4, 3, 2, 7, 4, 3, 5, 5, 4, 4, 6, 5, 5, 12, 4, 
    5, 3, 4, 3, 13, 6, 3, 4, 3, 2, 4, 3, 3, 5, 5, 6, 4, 4), label = "line number of respondent", format.stata = "%8.0g"), 
    gg114 = structure(c("HN", "H", "N", "CF", "F", "H", "", "F", 
    "JV", "", "FG", "N", "C", "GT", "P", "CN", "H", "F", "C", 
    "DFG", "F", "GH", "", "G", "", "", "G", "G", "", "P", "G", 
    "", "N", "FP", "CN", "G", "", "F", "", "", "O", "N", "Y", 
    "N", "CN", "C", "N", "H", "", "JN"), label = "reasons for discontinuing school/never attended school", format.stata = "%23s"), 
    gg101b = structure(c(16, 19, 17, 17, 17, 19, 18, 17, 14, 
    18, 18, 16, 19, 18, 17, 17, 19, 17, 19, 19, 18, 18, 17, 18, 
    18, 18, 16, 18, 18, 17, 17, 18, 16, 17, 19, 19, 18, 19, 19, 
    19, 19, 18, 18, 17, 19, 16, 19, 19, 18, 18), label = "age in completed years", format.stata = "%8.0g"), 
    gg105 = structure(c(10, 10, 9, 9, 10, 9, 12, 9, 9, 12, 9, 
    9, 9, 9, 9, 10, 9, 9, 10, 10, 9, 10, 12, 10, 12, 12, 9, 10, 
    12, 10, 9, 12, 9, 9, 10, 9, 12, 9, 12, 12, 9, 9, 9, 9, 9, 
    9, 9, 9, 12, 9), labels = c(`Never attended school/attended only a religious school` = 95), label = "completed years of schooling", class = c("haven_labelled", 
    "vctrs_vctr", "double")), rcat = structure(c(2, 2, 2, 2, 
    2, 2, 2, 2, 1, 2, 2, 2, 2, 2, 2, 2, 2, 2, 2, 2, 2, 2, 2, 
    2, 2, 2, 2, 2, 2, 2, 2, 2, 2, 2, 2, 2, 2, 2, 2, 2, 2, 2, 
    2, 2, 2, 2, 2, 2, 2, 2), labels = c(`UM10-14` = 1, `UM15-19` = 2, 
    `UF10-14` = 3, `UF15-19` = 4, `MF15-19` = 5), label = "respondent category", class = c("haven_labelled", 
    "vctrs_vctr", "double"))), row.names = c(NA, -50L), class = c("tbl_df", 
"tbl", "data.frame"))
library(tidyverse)
toy_df |> 
  ggplot() +
  geom_bar(aes(gg114, fill = if_else(gg114 %in% c('C', 'CF', 'CN'), gg114, NA))) +
  scale_fill_discrete(
    name = "Special reasons",
    breaks = c('C', 'CF', 'CN'),
    labels = c('C', 'CF', 'CN') # <- change to what you want to appear in legend
  ) +
  scale_x_discrete(name = "Reasons")

Created on 2024-08-14 with reprex v2.0.2

This topic was automatically closed 7 days after the last reply. New replies are no longer allowed.

If you have a query related to it or one of the replies, start a new topic and refer back with a link.