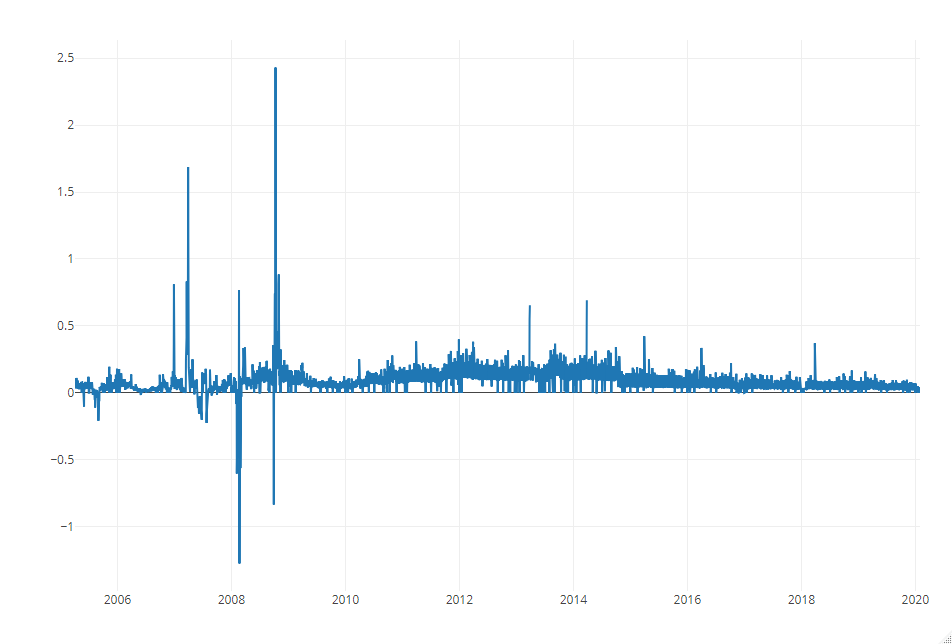
I want to make this plot attractive. Please suggest. Thanks in advance.
I would suggest using either ggplot2 or plotly
can you please share the codes for the ggplot2 or plotly.
Thanks in advance.
How to add label to y axis on graph made by plotly
Thank you very much for your help.