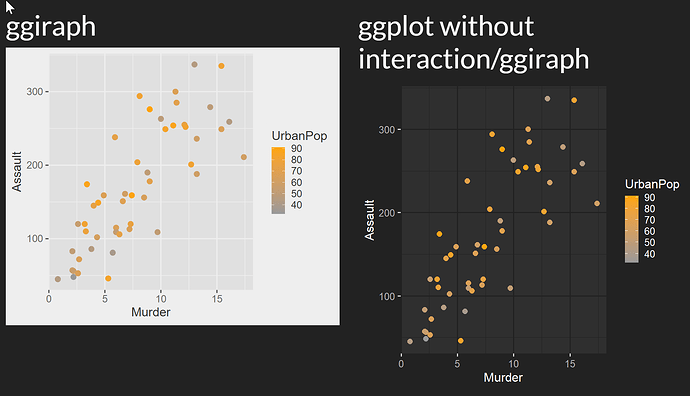
Hi,
I have a shiny web app that runs with a bslib theme, and I would love to make the ggplots inside the app have tooltips. I found ggiraph, which seems to have plenty of interactive geoms; however, the automatic styling with thematic does not work with ggiraph.
I made a small demo app:
library(shiny)
library(ggplot2)
library(thematic)
library(bslib)
library(ggiraph)

# setting ggplot theme
theme_set(ggplot2::theme_gray(base_size = 16))
thematic_shiny()
# bslib theme and colors
bs_theme_name <- "darkly"
bs_theme_used <- bs_theme(bootswatch = bs_theme_name)

# data prep (example from ggiraph: crimes)
crimes <- data.frame(state = tolower(rownames(USArrests)), USArrests)

gg_crime <- ggplot(crimes, aes(x = Murder, y = Assault, color = UrbanPop )) +
  geom_point_interactive(
    aes( data_id = state, tooltip = state), size = 3,
    hover_nearest = TRUE) +
  scale_colour_gradient(low = "#999999", high = "orange")

# Define UI for application that draws a histogram
ui <- fluidPage(
  theme = bs_theme_used,

  fluidRow(
    column(width = 6,
           h2("ggiraph"),
           ggiraph::girafeOutput("plot")),
    column(width = 6,
           h2("ggplot without interaction/ggiraph"),
           plotOutput("ggplot"))
  )
)


# Define server logic required to draw a histogram
server <- function(input, output) {

  output$plot <- renderGirafe({
    x <- girafe(code = print(gg_crime),
                width_svg = 6, height_svg = 5,
                options = list(
                  opts_hover(css = "fill:#FF3333;stroke:black;cursor:pointer;", reactive = TRUE),
                  opts_selection(
                    type = "multiple", css = "fill:#FF3333;stroke:black;")
                ))
    x
  })

  output$ggplot <- renderPlot({
    gg_crime
  })

}

# Run the application
shinyApp(ui = ui, server = server)
Any tipps on how I can make the thematic magic explicit so I can apply it to ggiraph? or vice versa, ideas on how to make ggiraph learn the thematic magic?
