How to make text for the whole plot window when there's multiple graphics?

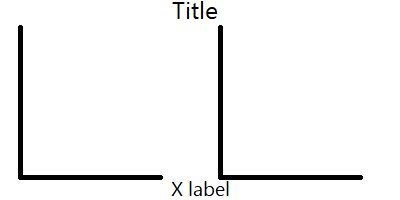
I'm basically remaking the same graphics 2X side-by-side. I don't need for the right one to have a Y label and I've taken care of that. Now I'd like for the X label to be between the graphics; I think 2 ways to do so would be to right-shift the left one or have mtext() set so it uses the whole area, as mtext() in each graphics seem to be limited to its graphic area (the ones before the 2nd plot on the left, those after on the right). In case you need a visual demonstration, here's one:
tmp117

I've tried "par(mfrow = c(1, 1))" then "plot.new()" then mtext() but the text seem to be centered at top-left of the plot window (thus left half cropped); if that worked I would have then done "par(mfrow = c(1, 2))". Any idea how to make text for whole plot window when there's multiple graphics? If possible I'd like it to be plain R (no additional package).

Thank you kindly

I have not used base plotting in many years, so this is a very rough sketch of a solution. I bet there is a more elegant way to do this.

MAT <- matrix(c(1,1,2,3,4,4),nrow = 3, byrow = TRUE)
MAT
#>      [,1] [,2]
#> [1,]    1    1
#> [2,]    2    3
#> [3,]    4    4
layout(MAT, widths = c(2.5,2), heights = c(1,4,1),respect = TRUE)
par(mar=c(1,4,4,2))
plot(NA, xlim = c(0,1), ylim = c(0,1), axes = FALSE, ylab = "")
text(x = 0.5, y = 0.5, label = "Title")

par(bty = "n", cex = 1, mar=c(2,4,0,2)) 
plot(1:3, 1:3, xlab = "", ylab = "The Values")

par(mar=c(2,0,0,2))
plot(1:3, 1:3, type = "b", axes = FALSE, xlab = "", ylab = "")
axis(side = 1)
axis(side = 2, labels = FALSE)

par(mar=c(3,4,0,2))
plot(NA, xlim = c(0,1), ylim = c(0,1), axes = FALSE, ylab = "")
text(x = 0.5, y = 0.5, label = "x label")

Created on 2024-04-24 with reprex v2.0.2

With a few modifications it worked almost as I hoped for, thanks. Now I have an issue with panel sizes. I was checking if parts of the graphic rendered but was "hidden" beyond the pane so I stretched it; I was planning to hit the Esc key so the size went back as before the stretch, but it wouldn't do so. I've been trying to find a way to reset panel sizes in vain, I'm especially concerned by the Plots ratio (width:height).

Are you looking for something like this?

MAT <- matrix(c(1,1,2,3,4,4),nrow = 3, byrow = TRUE)
MAT
#>      [,1] [,2]
#> [1,]    1    1
#> [2,]    2    3
#> [3,]    4    4
layout(MAT, widths = c(2.5,2), heights = c(1,2,1),respect = TRUE)
par(mar=c(1,4,4,2))
plot(NA, xlim = c(0,1), ylim = c(0,1), axes = FALSE, ylab = "")
text(x = 0.5, y = 0.5, label = "Title")

par(bty = "n", cex = 1, mar=c(2,4,0,2)) 
plot(1:3, 1:3, xlab = "", ylab = "The Values")

par(mar=c(2,0,0,2))
plot(1:3, 1:3, type = "b", axes = FALSE, xlab = "", ylab = "")
axis(side = 1)
axis(side = 2, labels = FALSE)

par(mar=c(3,4,0,2))
plot(NA, xlim = c(0,1), ylim = c(0,1), axes = FALSE, ylab = "")
text(x = 0.5, y = 0.5, label = "x label")

Created on 2024-04-24 with reprex v2.0.2

No, the GUI panels, what's at the bottom-right of

PS: Happy cake day.

This topic was automatically closed 7 days after the last reply. New replies are no longer allowed.

If you have a query related to it or one of the replies, start a new topic and refer back with a link.