How to make plot show the dates in the x-axis, and not the months?

Hello! I am back with a new problem. Right now I am working with a dataset, where I wish to show how the concentration in totp (total phosphorus) changes throughout the season. I've imported my dataset from excel into r-studio, and by using this code I've changed one of the columns into date and made a plot:

utlop <- utlop %>%
mutate(Date = lubridate::dmy(Date))

class(utlop$Date)

ggplot(data = utlop)+geom_line(mapping = aes(x=Date, y=Totp))+labs(title = "Total Phosphorus measured at the outlet of x")

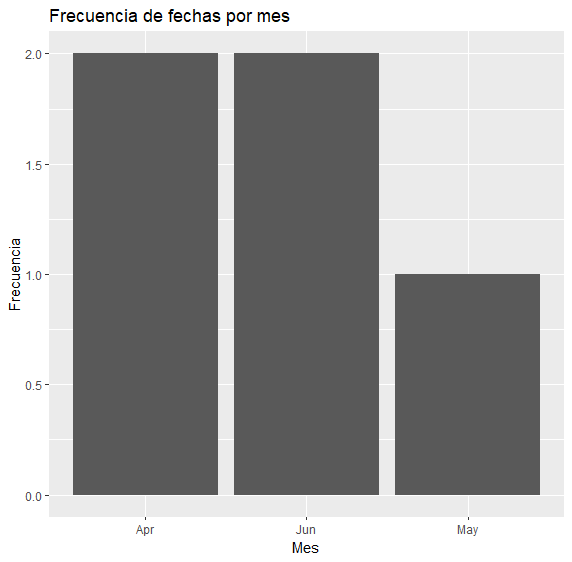
This gives me a plot, where everything looks great except I want the x-axis to show the specific dates the samples were taken. Right now it looks like this:

It only shows the months, not the specific dates. I also do not wish to include unnecessary dates, only the dates from the sampling. I will also include a picture of my dataset:

Thanks in advance for the help!

Hi @Aurora99, remember put a reproducible example of data, like this:

Other way is paste the result of

dput(head(youdataframe,20)) # Put the name of you data frame. Is for get the 20 first rows a columns. 
fechas <- as.Date(c("2023-04-23", "2023-05-15", "2023-06-08", "2023-04-05", "2023-06-20"))

#  data frame
df <- data.frame(Fecha = fechas)

# Extract month of a date column
df$Mes <- format(df$Fecha, "%b") # names of month

# plot
ggplot(df, aes(x = Mes)) +
  geom_bar() +
  labs(title = "Frecuencia month",
       x = "month",
       y = "Frecuency")

This topic was automatically closed 42 days after the last reply. New replies are no longer allowed.

If you have a query related to it or one of the replies, start a new topic and refer back with a link.