How to make only X axis without Y axis?

Dear all,
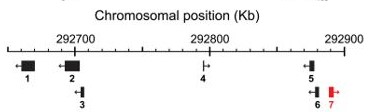
I would like to make graph with only X axis without Y axis. Like this,
Capture - Copy (2)

I tried to run this code,

datax <- c(8, 10)
datay <- c(0)
library(Hmisc)
plot(datax, axes = FALSE)
minor.tick(nx = 5, ny =5, tick.ratio = 0.5)
axis(2)
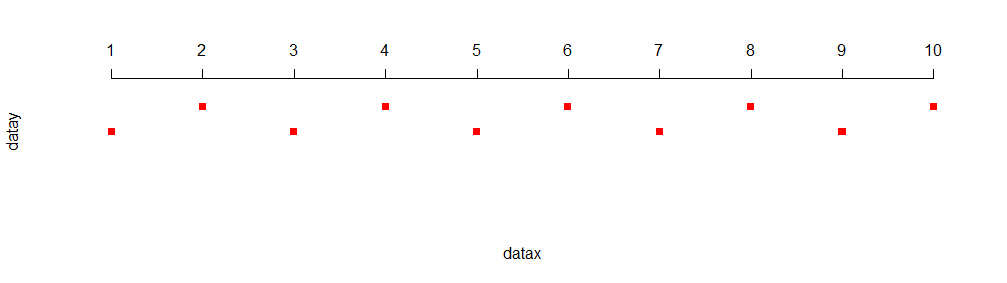
Then the result is like this,

It is really far from my expectation. I only want to change the position of Y axis in this graph to become X axis, only display that.
Does anyone can help me how to change this?
I appreciate your help.
Thank you!

Welcome. Are you after something like a grouped boxplot?

datax<-1:10
datay <- rep(c(1,2),5)
plot(datax,
    datay,
    axes=FALSE,
    pch=15,
    col="red",ylim=c(-1,3))
axis(3,
     at=1:10)

depending on how you set the plot window dimensions of Rstudio it can show like:

2 Likes

No, I did not do boxplot. What is the correlation with my question?

Hey, thank you.
I have a question, how to define the "datay" that you wrote?

It should be whatever your y data is on the invisible axis. I made it be the numbers one and two repeated 5 times.

thank you so much for your help

It is because the image in your first post is of grouped boxplots.

This topic was automatically closed 7 days after the last reply. New replies are no longer allowed.

If you have a query related to it or one of the replies, start a new topic and refer back with a link.