How to make each row of a data table into it's own table as part of a series of tables in an RMarkdown document

Dear RStudio Community,

How can I turn a dataframe, where each row of data is a unique observation, and turn it into a series of long tables where each table is an observation with two variables - the variable name and the value of the variable?

library(tibble)
library(tidyr)
library(dplyr)
#> 
#> Attaching package: 'dplyr'
#> The following objects are masked from 'package:stats':
#> 
#>     filter, lag
#> The following objects are masked from 'package:base':
#> 
#>     intersect, setdiff, setequal, union

# this is how my data looks, except I have many more variables
my_data <- tibble(
  id = c("001", "002", "003", "004"),
  color = c("red", "yellow", "blue", "violet"),
  fruit = c("apple", "banana", "blueberry", "plum"),
  animal = c("dog", "cat", "bird", "fish"),
  description = c("adorable", "curious", "bewildered", "dull")
)

# i want to display my data, in an rmarkdown document, as a series of long tables like this
my_target_data_id_001 <- tibble(
  "variable" = c(
    "color",
    "fruit",
    "animal",
    "description"
  ),
  "001" = c(
    "red",
    "apple",
    "dog",
    "adorable"
  )
)

my_target_data_id_002 <- tibble(
  "variable" = c(
    "color",
    "fruit",
    "animal",
    "description"
  ),
  "002" = c(
    "yellow",
    "banana",
    "cat",
    "curious"
  )
)

my_target_data_id_003 <- tibble(
  "variable" = c(
    "color",
    "fruit",
    "animal",
    "description"
  ),
  "003" = c(
    "blue",
    "blueberry",
    "bird",
    "bewildered"
  )
)

# and so on

Created on 2022-04-12 by the reprex package (v2.0.1)

Session info
sessionInfo()
#> R version 4.1.3 (2022-03-10)
#> Platform: x86_64-w64-mingw32/x64 (64-bit)
#> Running under: Windows 10 x64 (build 19044)
#> 
#> Matrix products: default
#> 
#> locale:
#> [1] LC_COLLATE=English_United States.1252 
#> [2] LC_CTYPE=English_United States.1252   
#> [3] LC_MONETARY=English_United States.1252
#> [4] LC_NUMERIC=C                          
#> [5] LC_TIME=English_United States.1252    
#> 
#> attached base packages:
#> [1] stats     graphics  grDevices utils     datasets  methods   base     
#> 
#> other attached packages:
#> [1] dplyr_1.0.8  tidyr_1.2.0  tibble_3.1.6
#> 
#> loaded via a namespace (and not attached):
#>  [1] pillar_1.7.0      compiler_4.1.3    highr_0.9         R.methodsS3_1.8.1
#>  [5] R.utils_2.11.0    tools_4.1.3       digest_0.6.29     evaluate_0.15    
#>  [9] lifecycle_1.0.1   R.cache_0.15.0    pkgconfig_2.0.3   rlang_1.0.2      
#> [13] reprex_2.0.1      DBI_1.1.2         cli_3.2.0         rstudioapi_0.13  
#> [17] yaml_2.3.5        xfun_0.30         fastmap_1.1.0     withr_2.5.0      
#> [21] styler_1.7.0      stringr_1.4.0     knitr_1.38        generics_0.1.2   
#> [25] fs_1.5.2          vctrs_0.3.8       tidyselect_1.1.2  glue_1.6.2       
#> [29] R6_2.5.1          fansi_1.0.3       rmarkdown_2.13    purrr_0.3.4      
#> [33] magrittr_2.0.2    ellipsis_0.3.2    htmltools_0.5.2   assertthat_0.2.1 
#> [37] utf8_1.2.2        stringi_1.7.6     crayon_1.5.1      R.oo_1.24.0
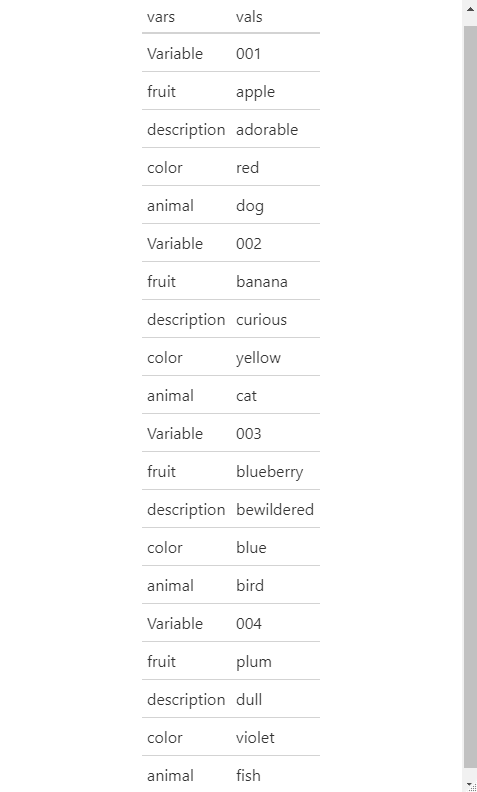
Here is one solution. The final call to ls() is only included to show that the desired data frames now exist. It isn't needed to get to your goal. I suggest changing the code to make the column names "legal". Perhaps put some set text in front of ID with

colnames(tmp)[2] <- paste0("ID_", ID)
library(dplyr)
library(tidyr)
library(purrr)
my_data <- tibble(
  id = c("001", "002", "003", "004"),
  color = c("red", "yellow", "blue", "violet"),
  fruit = c("apple", "banana", "blueberry", "plum"),
  animal = c("dog", "cat", "bird", "fish"),
  description = c("adorable", "curious", "bewildered", "dull")
)

my_data_long <- my_data %>% pivot_longer(cols = -id, names_to = "variable", values_to = "Val") 
IDs <- unique(my_data$id)
MyFunc <- function(ID) {
  tmp <- my_data_long %>% filter( id == ID) %>% select(-id)
  colnames(tmp)[2] <- ID
  assign(paste("My_target_data_id", ID, sep = "_"), tmp,  envir = .GlobalEnv)
}
walk(IDs, MyFunc)
ls()
#> [1] "IDs"                   "my_data"               "my_data_long"         
#> [4] "MyFunc"                "My_target_data_id_001" "My_target_data_id_002"
#> [7] "My_target_data_id_003" "My_target_data_id_004"

Created on 2022-04-12 by the reprex package (v0.2.1)

2 Likes

Thank you. I see the solution is to use the walk function.

The next piece of the puzzle is to display as tables within an RMarkdown document. It works when printing to the console, but not to my HTML RMarkdown document. I tried adding print(kable(tmp)) as the last line within the function, but the output is in plain markdown and not an HTML table.

It is readable, but I would prefer an HTML table. Thoughts?

I will not be on a computer where I can test solutions for several days. You might want to start a new thread for this part of the problem so others will be more likely to see the question.

This is a solution that almost works. My target solution should have each id in it's own table, not merely grouped within a table:

library(tibble)
library(tidyr)
library(dplyr)
#> 
#> Attaching package: 'dplyr'
#> The following objects are masked from 'package:stats':
#> 
#>     filter, lag
#> The following objects are masked from 'package:base':
#> 
#>     intersect, setdiff, setequal, union
library(stringr)
library(gt)

# this is how my data looks, except I have many more variables
my_data <- tibble(
  id = c("001", "002", "003", "004"),
  color = c("red", "yellow", "blue", "violet"),
  fruit = c("apple", "banana", "blueberry", "plum"),
  animal = c("dog", "cat", "bird", "fish"),
  description = c("adorable", "curious", "bewildered", "dull")
)

# an almost solution using group_by and gt
my_data %>% 
  mutate(id = str_c("id_", id)) %>%
  pivot_longer(cols = -id, names_to = "Variable", values_to = "Value") %>%
  group_by(id) %>%
  gt()
Variable Value
id_001
color red
fruit apple
animal dog
description adorable
id_002
color yellow
fruit banana
animal cat
description curious
id_003
color blue
fruit blueberry
animal bird
description bewildered
id_004
color violet
fruit plum
animal fish
description dull

Created on 2022-04-15 by the reprex package (v2.0.1)

Session info
sessionInfo()
#> R version 4.1.3 (2022-03-10)
#> Platform: x86_64-w64-mingw32/x64 (64-bit)
#> Running under: Windows 10 x64 (build 19044)
#> 
#> Matrix products: default
#> 
#> locale:
#> [1] LC_COLLATE=English_United States.1252 
#> [2] LC_CTYPE=English_United States.1252   
#> [3] LC_MONETARY=English_United States.1252
#> [4] LC_NUMERIC=C                          
#> [5] LC_TIME=English_United States.1252    
#> 
#> attached base packages:
#> [1] stats     graphics  grDevices utils     datasets  methods   base     
#> 
#> other attached packages:
#> [1] gt_0.4.0      stringr_1.4.0 dplyr_1.0.8   tidyr_1.2.0   tibble_3.1.6 
#> 
#> loaded via a namespace (and not attached):
#>  [1] pillar_1.7.0      compiler_4.1.3    highr_0.9         R.methodsS3_1.8.1
#>  [5] R.utils_2.11.0    tools_4.1.3       digest_0.6.29     checkmate_2.0.0  
#>  [9] gtable_0.3.0      evaluate_0.15     lifecycle_1.0.1   R.cache_0.15.0   
#> [13] pkgconfig_2.0.3   rlang_1.0.2       reprex_2.0.1      DBI_1.1.2        
#> [17] cli_3.2.0         rstudioapi_0.13   yaml_2.3.5        xfun_0.30        
#> [21] fastmap_1.1.0     withr_2.5.0       styler_1.7.0      knitr_1.38       
#> [25] sass_0.4.1        generics_0.1.2    fs_1.5.2          vctrs_0.3.8      
#> [29] grid_4.1.3        tidyselect_1.1.2  glue_1.6.2        R6_2.5.1         
#> [33] fansi_1.0.3       rmarkdown_2.13    ggplot2_3.3.5     purrr_0.3.4      
#> [37] magrittr_2.0.2    backports_1.4.1   scales_1.1.1      ellipsis_0.3.2   
#> [41] htmltools_0.5.2   assertthat_0.2.1  colorspace_2.0-3  utf8_1.2.2       
#> [45] stringi_1.7.6     munsell_0.5.0     crayon_1.5.1      R.oo_1.24.0

I don't think you need to be that complicated. With flexible use of pivot_wider and pivot_longer, you'll get:

ls1 <- my_data %>% group_by(id) %>% group_split() %>% map(
  ~.x %>% pivot_longer(-id, names_to = 'vars',values_to = 'vals') %>% 
    pivot_wider(names_from = 'id',values_from = 'vals')
) 

if you want to store each data.frame in the returned list with a specific name (though I do not recommend doing so):

for(x in ls1) {
  assign(x = str_glue('my_target_data_id_{names(x) %>% tail(1)}'),value = x)
}
1 Like

Thanks for the responses. All three proposed solutions work within an R Markdown document, but none of them are ideal. I've pasted the R Markdown below.

---
title: "how-to-make-each-row-of-a-data-table-into-its-own-table-as-part-of-a-series-of-tables-in-an-rmarkdown-document"
author: "rene_at_coco"
date: "5/4/2022"
output: html_document
---

```{r setup, include=FALSE}
knitr::opts_chunk$set(echo = TRUE)
library(tibble)
library(tidyr)
library(dplyr)
library(stringr)
library(gt)
library(purrr)
library(knitr)
# this is how my data looks, except I have many more variables
my_data <- tibble(
  id = c("001", "002", "003", "004"),
  color = c("red", "yellow", "blue", "violet"),
  fruit = c("apple", "banana", "blueberry", "plum"),
  animal = c("dog", "cat", "bird", "fish"),
  description = c("adorable", "curious", "bewildered", "dull")
)
# an almost solution using group_by and gt
my_data %>% 
  mutate(id = str_c("id_", id)) %>%
  pivot_longer(cols = -id, names_to = "Variable", values_to = "Value") %>%
  group_by(id) %>%
  gt()
my_data_long <- my_data %>% pivot_longer(cols = -id, names_to = "variable", values_to = "Val") 
IDs <- unique(my_data$id)
MyFunc <- function(ID) {
  tmp <- my_data_long %>% filter( id == ID) %>% select(-id)
  colnames(tmp)[2] <- ID
  assign(paste("My_target_data_id", ID, sep = "_"), tmp,  envir = .GlobalEnv)
  print(kable(tmp))
}
walk(IDs, MyFunc)
# ls()
ls1 <- my_data %>% group_by(id) %>% group_split() %>% map(
  ~.x %>% pivot_longer(-id, names_to = 'vars',values_to = 'vals') %>% 
    pivot_wider(names_from = 'id',values_from = 'vals')
) 
ls1

maybe you want something like this?

my_data %>% mutate(Variable = id) %>% group_split(id) %>% map_dfr(
  ~ .x %>% pivot_longer(-id, names_to = 'vars',values_to = 'vals') %>% 
    arrange(desc(vars))
) %>% select(-id) %>% gt()

though I don't think it is a good one for boundry of each table is unclear.

1 Like

Yes, I think the gt solution I presented earlier is a better option than this one because in this one there is not a distinct separation between each "Variable" group.

if you are in markdown, and targetting html, you have incredible power to style gt.
In this example, I will create multiple gt(s) each styled similarly and present them seperated by html break (br), htmltools is very useful in this sort of context.

---
title: "how-to-make-each-row-of-a-data-table-into-its-own-table-as-part-of-a-series-of-tables-in-an-rmarkdown-document"
author: "rene_at_coco"
date: "5/4/2022"
output: html_document
---
```{r setup, include=FALSE}
library(knitr)
library(tidyverse)
library(gt)
library(htmltools)
opts_chunk$set(echo = TRUE)


# this is how my data looks, except I have many more variables
my_data <- tibble(
  id = c("001", "002", "003", "004"),
  color = c("red", "yellow", "blue", "violet"),
  fruit = c("apple", "banana", "blueberry", "plum"),
  animal = c("dog", "cat", "bird", "fish"),
  description = c("adorable", "curious", "bewildered", "dull")
)

```

```{r}

# an almost solution using group_by and gt
my_data %>% 
  mutate(id = str_c("id_", id)) %>%
  pivot_longer(cols = -id, names_to = "Variable", values_to = "Value") %>%
  group_by(id) %>%
group_split() %>% map(~{
  table_id <- unique(pull(.x,
                          id))
  rest_of_table <- select(.x, - id)
  div(gt(rest_of_table) %>% tab_header(title=table_id) %>% opt_align_table_header( align = "left") %>% tab_options(table.width  = px(500)) %>% 
                              cols_width(everything()~px(250)),
                            tags$br())}) %>% tagList()
```
1 Like

Yes, that's a solution that works for me. Looks like it is a combination of map, pull, and div to result in one document with each row turned into its own table.

Not to say that other solutions did not result in unique tables, but I couldn't figure out how to get them to display properly in the RMarkdown document.

This topic was automatically closed 7 days after the last reply. New replies are no longer allowed.

If you have a query related to it or one of the replies, start a new topic and refer back with a link.