Here's one plotting tool.
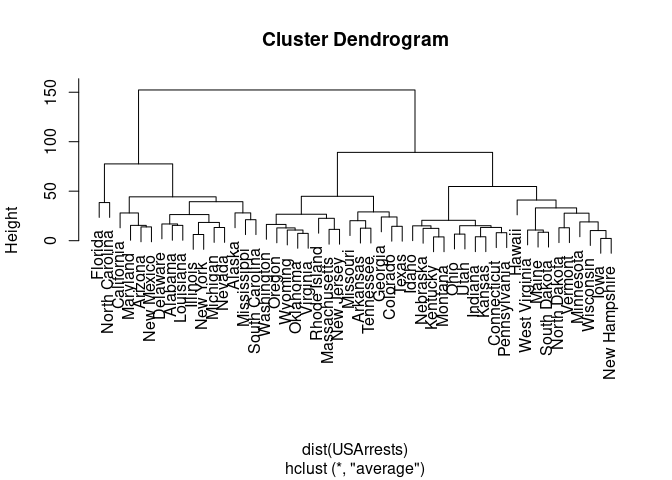
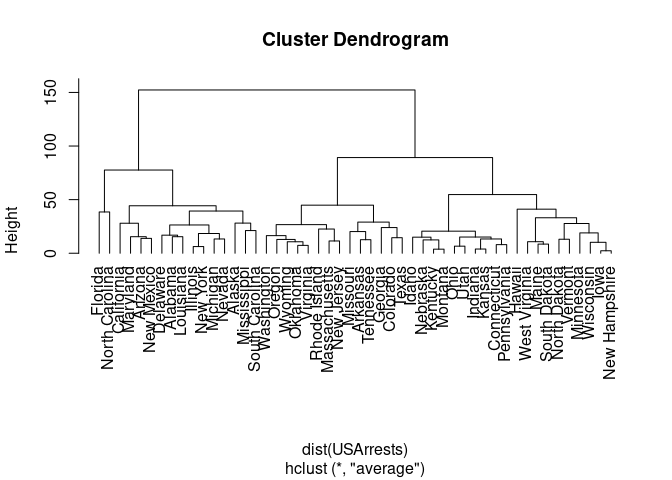
hc <- hclust(dist(USArrests), "ave")
plot(hc)
plot(hc, hang = -1)
Created on 2022-12-20 by the reprex package (v2.0.1)
See the FAQ: How to do a minimal reproducible example reprex for beginners for how to attract more precise answers.