Hi, I would like to make a dendrogram of precipitation to see which months are more similar (which months are dry and which are rainy), my Y is the average of total precipitation over the years and my X are the months of the year. Could you help me?
Here's one plotting tool.
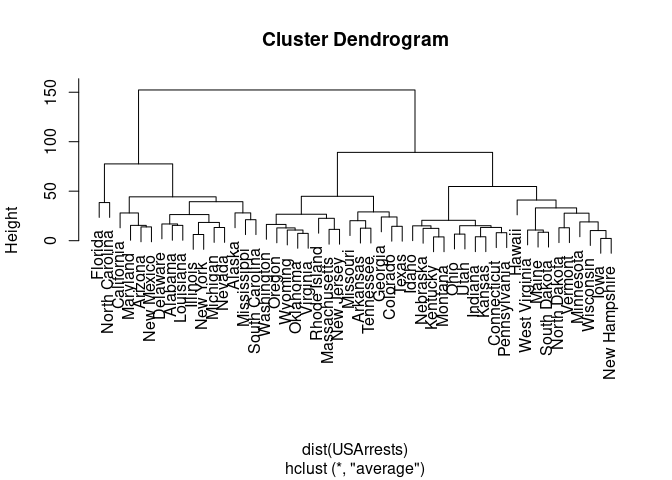
hc <- hclust(dist(USArrests), "ave")
plot(hc)
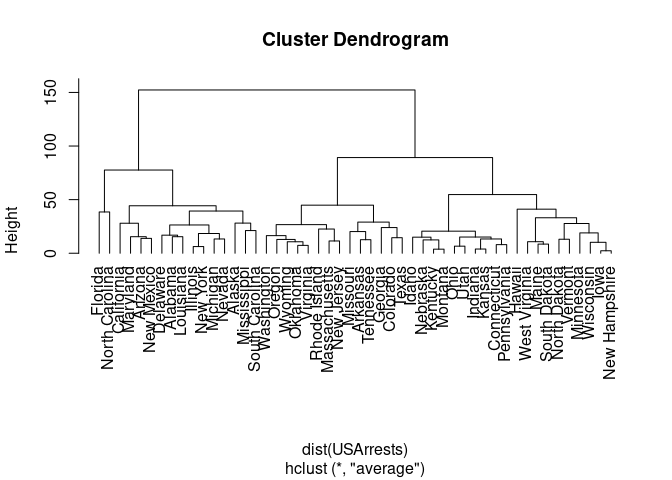
plot(hc, hang = -1)
Created on 2022-12-20 by the reprex package (v2.0.1)
See the FAQ: How to do a minimal reproducible example reprex for beginners for how to attract more precise answers.
2 Likes
This topic was automatically closed 42 days after the last reply. New replies are no longer allowed.
If you have a query related to it or one of the replies, start a new topic and refer back with a link.