I am working on geography domain. We have sediment age data with their uncertainty.
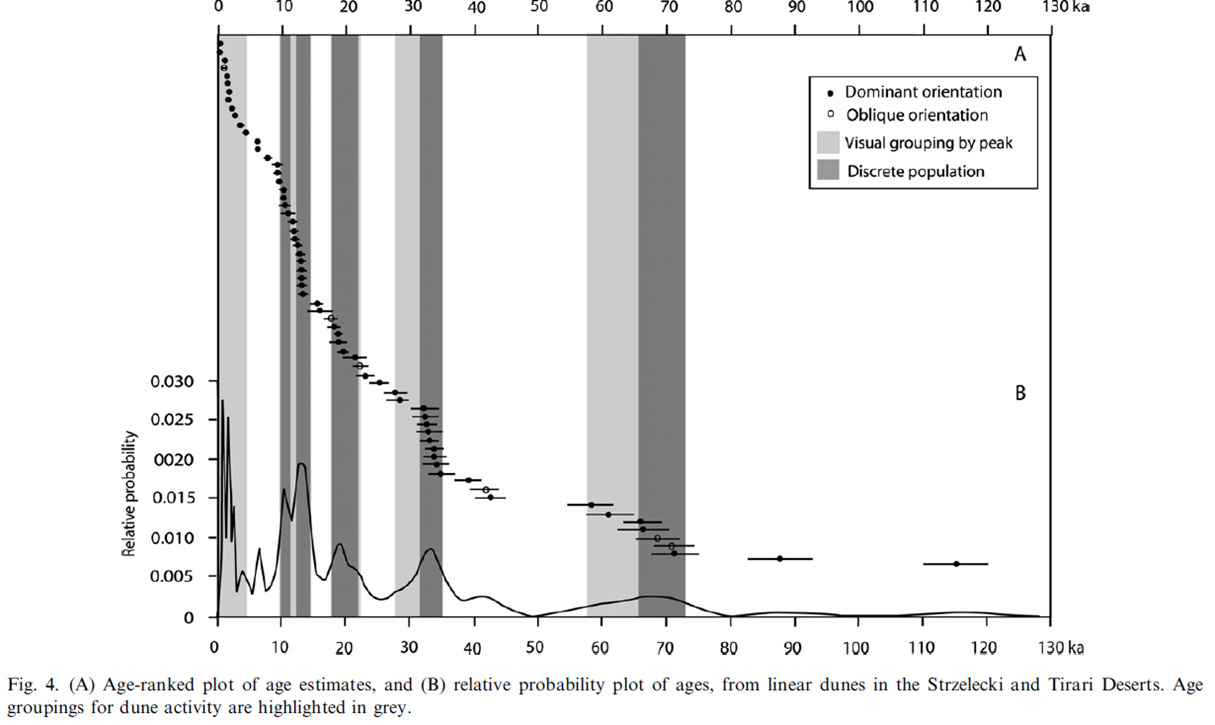
In few paper I saw age-ranked plot of age estimates, and (B) relative probability plot of ages (as attached here).
-
I need to plot same ranked ages plot along with relative probability curves for my data.
my data is like 2±0.1; 102±1 etc......
data is 150 points.
I could make probability plot using KDE function but Not able to make rank age plot as superimposed. -
I need to make age groupings after making this plot. I want to use reduced Chi-Square Test. Anyone can help me how to set this test in R.
Basically we need to make age groups of values which are close to each other to highlight the most common events occurred in the past.
I can share my data if needed.