I am trying to let shiny do a calculation with slide bar values after the user clicks on the action button. These slide bars represent five dimensions which the user can drag to set his preferred weight value per variable. After the action button has been clicked, the app should then show a map of The Netherlands with the municipalities that have the highest 'score' based on these weight values. At the moment I've got the following code running, but very slowly after you click the Action Button, as it will automatically re-execute when the reactive slide bars change. Does someone have a suggestion to make my code faster and the action button eventReactive so that it has to be clicked to let shiny know to do a new calculation?
I've included a gist link to my main script since I could not think of an easier way to share my data (spatialpolygonsdataframe): Main script for Dutch quality-of-life-o-meter Shiny app · GitHub
library(shiny)
library(leaflet)
ui <- fluidPage(
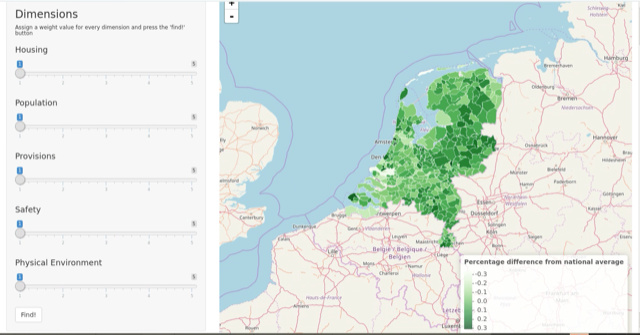
titlePanel("Quality-of-life-o-meter of The Netherlands"),
sidebarLayout(
sidebarPanel(
h3("Dimensions"),
h6("Assign a weight value for every dimension and press the 'find!' button"),
sliderInput("housingslider",
label = h4("Housing"),
min = 1,
max = 5,
value = 1),
sliderInput("populationslider",
label = h4("Population"),
min = 1,
max = 5,
value = 1),
sliderInput("provisionsslider",
label = h4("Provisions"),
min = 1,
max = 5,
value = 1),
sliderInput("safetyslider",
label = h4("Safety"),
min = 1,
max = 5,
value = 1),
sliderInput("physicalenvslider",
label = h4("Physical Environment"),
min = 1,
max = 5,
value = 1),
actionButton("action", label = "Find!")
),
mainPanel(
leafletOutput("mymap", height = "800")
)
)
)
server <- function(input, output, session) {
output$mymap <-renderLeaflet({
# Create interactive map of Total Score of Muncipalities in 2016 to display first
leaflet(data = MunScores2016) %>% addTiles() %>%
addPolygons(fillColor = ~pal(Total_Score_2016),
fillOpacity = 1,
color = 'white',
weight = 1,
popup = popup_dat) %>%
addLegend("bottomright", # Legend position
pal=pal, # color palette
values=~Total_Score_2016, # legend values
opacity = 0.7,
title="Percentage difference from national average")
})
observeEvent(input$action,
output$mymap <-renderLeaflet({
Total_Score <- NA
Total_Score <- ((input$housingslider * MunScores2016$Housing_Score_2016 +
input$populationslider * MunScores2016$Population_Score_2016 +
input$provisionsslider * MunScores2016$Provisions_Score_2016 +
input$safetyslider * MunScores2016$Safety_Score_2016 +
input$physicalenvslider * MunScores2016$PhysicalEnvironment_Score_2016)/
(input$housingslider + input$populationslider + input$provisionsslider + input$safetyslider + input$physicalenvslider))
#Create interactive map
leaflet(data = MunScores2016) %>% addTiles() %>%
addPolygons(fillColor = ~pal(Total_Score),
fillOpacity = 1,
color = 'white',
weight = 1,
popup = paste0("<strong>Municipality:</strong>",
MunScores2016$Municipality_Name,
"<br><strong>Quality-of-life-o-meter says: </strong>",
Total_Score)) %>%
addLegend("bottomright", # Legend position
pal=pal, # color palette
values=~Total_Score_2016, # legend values
opacity = 0.7,
title="Weighted percentage difference from national average")
})
)
}
shinyApp(ui = ui, server = server)