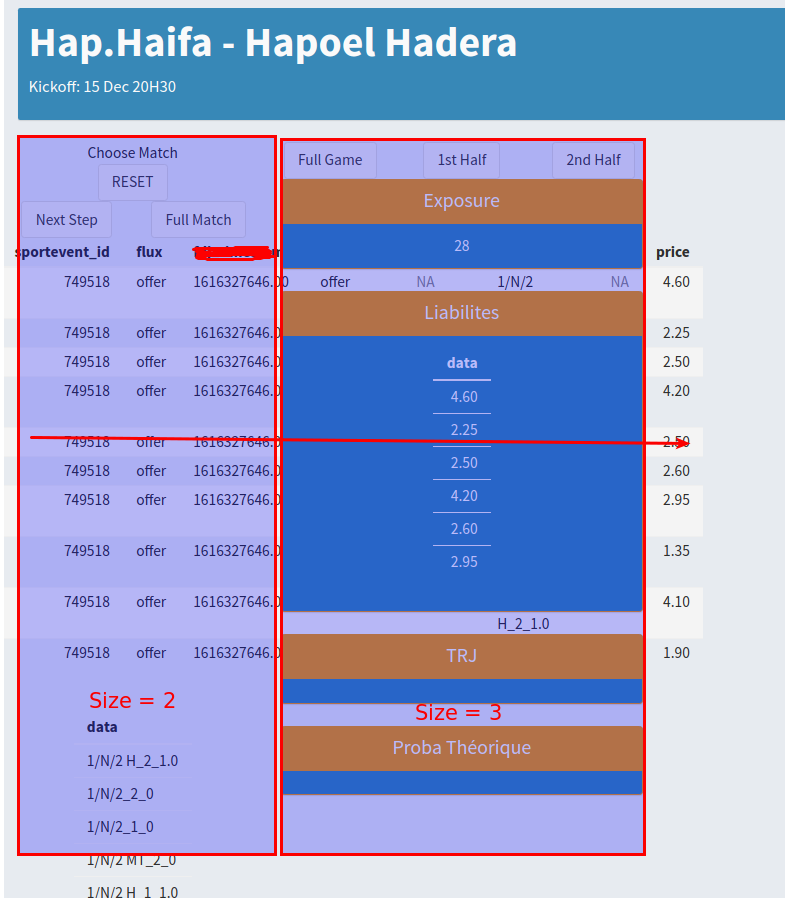
Do the size matter, YES for my table.
I'm new to shiny, and R in general, I admit but I cannot find on the internet a single solution to make a table shrink and fit the column(2, ... attribute is wrapped in.
The table should be around 15% of the page width, but it takes around a 1/3 because I have mane columns. I find out the possibility to have a horizontal slider but it's not what I want.
I want to make a dashboard with many information in it on purpose.
EDIT : Add some code.
# Just the body part of a dashboardPage object
body <-   # Body
  dashboardBody(
    # Match simulated (hardcoded)
    fluidRow(
      valueBox(paste0("Hap.Haifa - Hapoel Hadera"), "Kickoff: 15 Dec 20H30 ",
               icon = icon("futbol"), color="light-blue", width=12),
    ),

    # Top level indicators
    fluidRow(
      align = "center",
      column(2,
             fluidRow(
               "Choose Match"
             ),
             fluidRow(
               actionButton("goButton1", "RESET"),
             ),
             fluidRow(
               column(6,
                      actionButton("goButton2", "Next Step"),
               ),
               column(6,
                      actionButton("goButton3", "Full Match")
               )
             ),
             fluidRow(
               tableOutput('table_betflow') # I want this to shinrk into the 2 columns
             ),
             fluidRow(
               tableOutput('table_outcomes')
             )
      ),# Fin Première Colonne
      column(3,
            fluidRow(
              column(4,
                     actionButton("goButton4", "Full Game"),
              ),
              column(4,
                     actionButton("goButton5", "1st Half")
              ),
              column(4,
                     actionButton("goButton6", "2nd Half")
              )
            ),
            box(
              title = "Exposure",
              status = "warning",
              width = NULL,
              solidHeader = TRUE,
              background = "light-blue",
              "28"
            ),
            box(
              title = "Liabilites",
              status = "warning",
              width = NULL,
              solidHeader = TRUE,
              background = "light-blue",
              fluidRow(
                column(12,
                       tableOutput('table_prices')
                )
              )
            ),
            box(
              title = "TRJ",
              status = "warning",
              width = NULL,
              solidHeader = TRUE,
              background = "light-blue",
              fluidRow(
                column(12,
                       # tableOutput('table_outcomes')
                )
              )
            ),
            box(
              title = "Proba Théorique",
              status = "warning",
              width = NULL,
              solidHeader = TRUE,
              background = "light-blue",
              fluidRow(
                column(12,
                       # tableOutput('table_outcomes')
                )
              )
            ),
     ), # Fin Seconde Colonne

    ) # Fin FluidRow

  ) # Fin dashboardBody