How to make a map showing temperature across a river

Hi there,

I am hoping to get some advice/guidance on how to make a map as an R newbie.

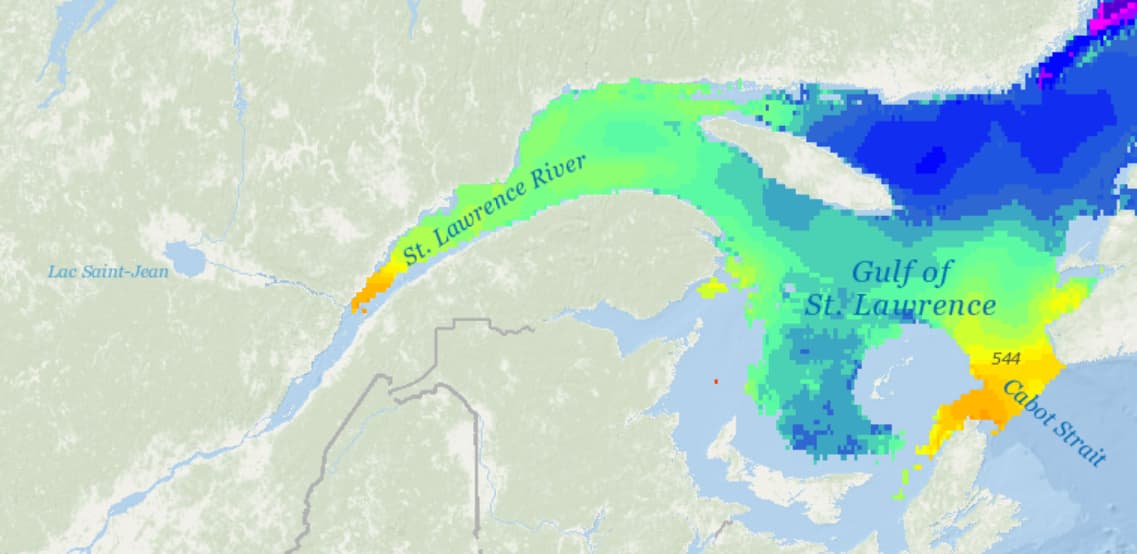
I want to make a map showing a temperature gradient across a river. I have the longitudes, latitudes, temperature and other environmental variables such as salinity. I am envisioning something like this:

This is what my data looks like:

> dput(water)
structure(list(ID = c(482914L, 482555L, 482536L, 482928L, 482592L, 
482563L, 482520L, 482530L, 482942L, 482508L, 482573L, 482570L, 
482524L, 482505L, 482599L, 482544L, 482539L, 482533L, 482514L, 
482516L, 482933L, 482951L, 482909L, 482904L, 482578L, 482511L, 
482502L, 482549L, 482583L), Lat = c(49.1655, 48.2795, 48.057667, 
49.764, 48.954, 48.558667, 47.742333, 47.696, 49.616, 47.094667, 
48.575667, 48.473667, 47.696, 46.887167, 49.0365, 48.348333, 
48.072833, 48.027667, 47.403833, 47.3935, 49.749167, 49.412833, 
49.040333, 48.830667, 48.787833, 47.415667, 49.0365, 48.317333, 
48.666833), Long = c(-67.2685, -69.072167, -69.548833, -66.8895, 
-68.0945, -68.845333, -69.927833, -69.821667, -66.661167, -70.716167, 
-68.489833, -68.6655, -69.821667, -70.9235, -68.267667, -69.327667, 
-69.6245, -69.485667, -70.283833, -70.229833, -65.500333, -66.481, 
-67.104167, -67.857, -68.711167, -70.440833, -68.267667, -69.199667, 
-68.581167), Temp = c(10.48, 5, 6.77, 9.48, 10.72, 6.04, 8.33, 
10.05, 11.37, 19.26, 6.92, 6.4, 10, 23.7, 4.87, 5.95, 2.88, 5.49, 
17.55, 15.27, 9.54, 10.74, 6.32, 8.97, 9.84, 13.45, 23.4, 5.2, 
11.12), Salinity = c(29.16, 28.87, 26.78, 29.53, 24.77, 29.11, 
24.14, 22.81, 28.99, 6.82, 28.63, 28.78, 23.13, 0.12, 29.9, 29.42, 
30.77, 28.37, 9.96, 13.57, 29.97, 29.18, 28.99, 27.65, 27.2, 
16.31, 0.12, 29.41, 27.54)), class = "data.frame", row.names = c(NA, 
-29L))

I am not sure how to go about starting and which packages to use... I have gotten as far as to crop the area I am interested in using ggmap

library(ggmap)
qc <- c(left = -74, bottom = 45, right = -58, top = 52)
map <- get_stamenmap(qc, zoom = 7, maptype = "toner-lite")
ggmap(map)

Any help is appreciated, thank you.

Something along these lines for the data. Area fill requires either polygon objects or some algo to interpolate from the POINT geometries.

library(ggplot2)
library(sf)
#> Linking to GEOS 3.11.0, GDAL 3.5.3, PROJ 9.1.0; sf_use_s2() is TRUE

d <- data.frame(
  ID = c(
    482914, 482555, 482536, 482928, 482592,
    482563, 482520, 482530, 482942, 482508, 482573, 482570,
    482524, 482505, 482599, 482544, 482539, 482533, 482514,
    482516, 482933, 482951, 482909, 482904, 482578, 482511,
    482502, 482549, 482583
  ),
  Lat = c(
    49.1655, 48.2795, 48.057667,
    49.764, 48.954, 48.558667, 47.742333, 47.696, 49.616, 47.094667,
    48.575667, 48.473667, 47.696, 46.887167, 49.0365, 48.348333,
    48.072833, 48.027667, 47.403833, 47.3935, 49.749167, 49.412833,
    49.040333, 48.830667, 48.787833, 47.415667, 49.0365, 48.317333,
    48.666833
  ), Long = c(
    -67.2685, -69.072167, -69.548833, -66.8895,
    -68.0945, -68.845333, -69.927833, -69.821667, -66.661167, -70.716167,
    -68.489833, -68.6655, -69.821667, -70.9235, -68.267667, -69.327667,
    -69.6245, -69.485667, -70.283833, -70.229833, -65.500333, -66.481,
    -67.104167, -67.857, -68.711167, -70.440833, -68.267667, -69.199667,
    -68.581167
  ), Temp = c(
    10.48, 5, 6.77, 9.48, 10.72, 6.04, 8.33,
    10.05, 11.37, 19.26, 6.92, 6.4, 10, 23.7, 4.87, 5.95, 2.88, 5.49,
    17.55, 15.27, 9.54, 10.74, 6.32, 8.97, 9.84, 13.45, 23.4, 5.2,
    11.12
  ), Salinity = c(
    29.16, 28.87, 26.78, 29.53, 24.77, 29.11,
    24.14, 22.81, 28.99, 6.82, 28.63, 28.78, 23.13, 0.12, 29.9, 29.42,
    30.77, 28.37, 9.96, 13.57, 29.97, 29.18, 28.99, 27.65, 27.2,
    16.31, 0.12, 29.41, 27.54
  )
)

d |> ggplot(aes(Lat,Long)) + 
  geom_point() +
  theme_minimal()


dsf <- st_as_sf(d, coords = c("Long", "Lat"), crs = 4326)

ggplot(dsf, aes(color = Temp, size = 3)) +
  geom_sf() +
  scale_color_viridis_b() +
  theme_minimal()

Created on 2023-07-17 with reprex v2.0.2

In most cases, unless the data has been pre-digested, mapping is pretty hard work, in any software package. I have a blog entry that might help. It also has many references and links in it.

1 Like

“Thorough” doesn’t begin to adequately describe your link as a top essential in #RGIS

This topic was automatically closed 42 days after the last reply. New replies are no longer allowed.

If you have a query related to it or one of the replies, start a new topic and refer back with a link.