How to let user to select variables x and y using selectInput

Dear colleagues I need your help to let the user to select 'x and y-variable' when the .csv is uploaded.
I have build the app, but the selectInput does not function.
Any help will be much appreciated. Thank you in advance and have a great day.

library(DT)
library(shiny)
library(shinydashboard)
library(shinydashboardPlus)
library(ggvis)
library(ggplot2)
library(dplyr)
shinyUI(dashboardPage(        
 dashboardHeader(title = "Data Visualization"),
    dashboardSidebar(
        width = 350,
        radioButtons(
            "fileType_Input",
            label = h4("Choose File type"),
            choices = list(".csv/txt" = 1, ".xlsx" = 2),
            selected = 1,
            inline = TRUE
        ),
        fileInput(
            'file1',
            h4('Upload Your Data'),
            accept = c(
                'text/csv',
                'text/comma-separated-values,text/plain',
                '.csv',
                '.xlsx'
            )),
        sidebarMenu(
            
            selectInput(inputId = "x", label = "Select x-axis Variable:",
                        choices = colnames(df)),               
            selectInput(inputId = "y", label = "Select y-axis Variable:",
                        choices = colnames(df)),                          
            menuItem("Raw Data", tabName = "RawData",
                     icon = icon("table")),                
            menuItem("Data Summary", tabName = "DataSummary",
                     icon = icon("calculator")),
            menuItem("Charts", tabName = "Charts",
                     icon = icon("chart-bar"))        
            )),
    dashboardBody(
        tabItems(
            tabItem( tabName = "RawData",
            fluidRow(
                box(
                    title = "View Data", 
                    width = NULL,
                    status = "primary", 
                    solidHeader = TRUE,
                    collapsible = TRUE,
                    
                    DT::dataTableOutput('contents'))               
            )),
        tabItem(tabName = "DataSummary",
    
           box(verbatimTextOutput("summary"))           
        ), 
        tabItem(tabName = "Charts",
        box(
            plotOutput('plot'))             
        )
        
    ))
))

 shinyServer(function(input, output, session) {
  myData <- reactive({
   req(input$file1)
    inFile <- input$file1
    if (is.null(inFile)) return(NULL)
    data <- read.csv(inFile$datapath, header = TRUE)
    data
  })

  output$contents <- DT::renderDataTable({
    DT::datatable(myData())       
  })

  observe({
    data <- myData()
    updateSelectInput(session, 'x', choices = names(data))
  }) 

   #gets the x variable name, will be used to change the plot legends
   xVarName <- reactive({
    input$x
  }) 

  observe({
    data <- myData()
    updateSelectInput(session, 'y', choices = names(data))
    }) 
   #gets the y variable name, will be used to change the plot legends
   yVarName <- reactive({
    input$y
  })   
   output$summary <- renderPrint({
     summary(myData())
   })
   output$select <- renderUI({
     df <- myData()
      selectInput("variable", "Variable:",names(df))    
    })       
  output$plot <- renderPlot({
    df <- myData()
     df  <- df[,input$variable]
     ggplot(df, aes_string(x = input$x, y = input$y))+
       geom_line()
    })
    })
it looks to me like all the code to make the selectise works just fine. although there is redundant/useless code here

colnames(df)

because this is not reactive, and theres not even a df object in scope of the this ui declation.

I think you have a more fundamental problem in that your code wont even run at all.
I expect a shiny app to be structured like :

library(shiny)

ui <- fluidPage(
  
)

server <- function(input, output, session) {
  
}

shinyApp(ui, server)

but you had shinyUI(dashboardPage rather than ui <-dashboardPage
shinyUI is not a function I'm aware of...
and you omit to have the shinyApp() function call at the end.
I had to fix some mismatch braces errors.
hey, this still has whatever problems, but the selectize 'works' and it executes.

library(DT)
library(shiny)
library(shinydashboard)
library(shinydashboardPlus)
library(ggvis)
library(ggplot2)
library(dplyr)
shinyUI<-dashboardPage(        
  dashboardHeader(title = "Data Visualization"),
  dashboardSidebar(
    width = 350,
    radioButtons(
      "fileType_Input",
      label = h4("Choose File type"),
      choices = list(".csv/txt" = 1, ".xlsx" = 2),
      selected = 1,
      inline = TRUE
    ),
    fileInput(
      'file1',
      h4('Upload Your Data'),
      accept = c(
        'text/csv',
        'text/comma-separated-values,text/plain',
        '.csv',
        '.xlsx'
      )),
    sidebarMenu(
      
      selectInput(inputId = "x", label = "Select x-axis Variable:",choices = NULL),               
      selectInput(inputId = "y", label = "Select y-axis Variable:",choices = NULL),                          
      menuItem("Raw Data", tabName = "RawData",
               icon = icon("table")),                
      menuItem("Data Summary", tabName = "DataSummary",
               icon = icon("calculator")),
      menuItem("Charts", tabName = "Charts",
               icon = icon("chart-bar"))        
    )),
  dashboardBody(
    tabItems(
      tabItem( tabName = "RawData",
               fluidRow(
                 box(
                   title = "View Data", 
                   width = NULL,
                   status = "primary", 
                   solidHeader = TRUE,
                   collapsible = TRUE,
                   
                   DT::dataTableOutput('contents'))               
               )),
      tabItem(tabName = "DataSummary",
              
              box(verbatimTextOutput("summary"))           
      ), 
      tabItem(tabName = "Charts",
              box(
                plotOutput('plot'))             
      )
      
    ))
)

server <- function(input, output, session) {
  myData <- reactive({
    req(input$file1)
    inFile <- input$file1
    if (is.null(inFile)) return(NULL)
    data <- read.csv(inFile$datapath, header = TRUE)
    data
  })
  
  output$contents <- DT::renderDataTable({
    DT::datatable(myData())       
  })
  
  observe({
    data <- myData()
    updateSelectInput(session, 'x', choices = names(data))
  }) 
  
  #gets the x variable name, will be used to change the plot legends
  xVarName <- reactive({
    input$x
  }) 
  
  observe({
    data <- myData()
    updateSelectInput(session, 'y', choices = names(data))
  }) 
  #gets the y variable name, will be used to change the plot legends
  yVarName <- reactive({
    input$y
  })   
  output$summary <- renderPrint({
    summary(myData())
  })
  output$select <- renderUI({
    df <- myData()
    selectInput("variable", "Variable:",names(df))    
  })       
  output$plot <- renderPlot({
    df <- myData()
    df  <- df[,input$variable]
    ggplot(df, aes_string(x = input$x, y = input$y))+
      geom_line()
  })
}

shinyApp(shinyUI, server)

Thanks alot for your comment. I have adjusted the errors as you pointed out. I am new to programming, I actually spent many hrs learning by reading the discussions and videos, I have to start somewhere:-)
After the adjustment as you suggested, but it does not run the app, neither it shows the options 'select x and y variables. The revised code as follow:

library(devtools)
library(rpivotTable)
library(DT)
library(shiny)
library(shinydashboard)
library(shinydashboardPlus)
library(ggvis)
library(ggplot2)
library(dplyr)

# Define UI for application that draws a histogram
 shinyUI <- dashboardPage(
    dashboardHeader(title = "Data Visualization"),
    dashboardSidebar(
        width = 350,
        radioButtons(
            "fileType_Input",
            label = h4("Choose File type"),
            choices = list(".csv/txt" = 1, ".xlsx" = 2),
            selected = 1,
            inline = TRUE
        ),
        fileInput(
            'file1',
            h4('Upload Your Data'),
            accept = c(
                'text/csv',
                'text/comma-separated-values,text/plain',
                '.csv',
                '.xlsx'
            )),
        
        sidebarMenu(
            
            selectInput(inputId = "x", label = "Select x-axis Variable:",
                        choices = NULL),
           
            selectInput(inputId = "y", label = "Select y-axis Variable:",
                        choices = NULL),
      
            
            menuItem("Raw Data", tabName = "RawData",
                     icon = icon("table")),
            
            menuItem("Data Summary", tabName = "DataSummary",
                     icon = icon("calculator")),
            menuItem("Charts", tabName = "Charts",
                     icon = icon("chart-bar"))
                    
            )),
    dashboardBody(
        tabItems(
            tabItem( tabName = "RawData",
            fluidRow(
                box(
                    title = "View Data", 
                    width = NULL,
                    status = "primary", 
                    solidHeader = TRUE,
                    collapsible = TRUE,
                    
                    DT::dataTableOutput('contents'))
                
            )),
        tabItem(tabName = "DataSummary",
    
           box(verbatimTextOutput("summary"))
            
        ), 
        tabItem(tabName = "Charts",
        box(
            plotOutput('plot'))
            
        )
        
    ))
  )
 
 shinyServer <- function(input, output, session) {
      # Get the upload file
  myData <- reactive({
   req(input$file1)
  inFile <- input$file1
  if (is.null(inFile)) return(NULL)
 data <- read.csv(inFile$datapath, header = TRUE)
 data
   })

    output$contents <- DT::renderDataTable({
    DT::datatable(myData())       
   })

      observe({
      data <- myData()
      updateSelectInput(session, 'x', choices = names(data))
   }) 
   #gets the x variable name, will be used to change the plot legends
      xVarName <- reactive({
    input$x
   }) 

   observe({
    data <- myData()
     updateSelectInput(session, 'y', choices = names(data))
   }) 
   #gets the y variable name, will be used to change the plot legends
  yVarName <- reactive({
    input$y
   }) 

   output$summary <- renderPrint({
   summary(myData())
     })
  output$select <- renderUI({
    df <- myData()
    selectInput("variable", "Variable:",names(df))

       })

    output$plot <- renderPlot({
    df <- myData()
    df <- df[,input$variable]
    ggplot(df, aes_string(x = input$x, y = input$y))+
       geom_line()
  })
 }
 shinyApp(shinyUI, shinyServer)

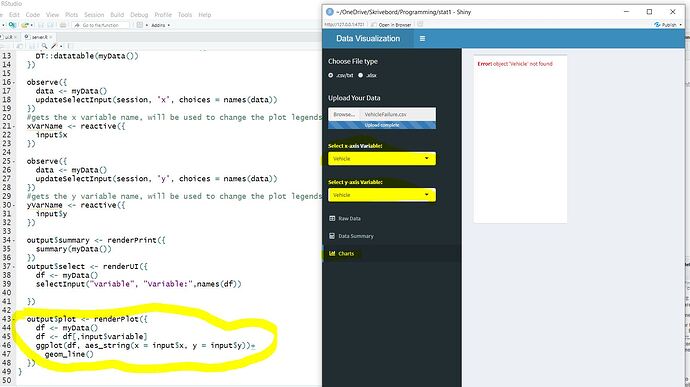
The app runs now, however the variable option for the plot doesn't work. Please see the figure below:


I hope someone can help.
Thanks in advance.

In your example what do you expect input$variable to be

The input$var has to be associated with (columns header), which can be selected by the user both for datatable and plots. f.eks select 2 columns one as x_axis and one for y_axis.
Thanks and take care.

I think you are mistaken.
This code works for what you said... I only commented out certain lines

# library(devtools)
# library(rpivotTable)
library(DT)
library(shiny)
library(shinydashboard)
library(shinydashboardPlus)
library(ggvis)
library(ggplot2)
library(dplyr)

# Define UI for application that draws a histogram
shinyUI <- dashboardPage(
  dashboardHeader(title = "Data Visualization"),
  dashboardSidebar(
    width = 350,
    radioButtons(
      "fileType_Input",
      label = h4("Choose File type"),
      choices = list(".csv/txt" = 1, ".xlsx" = 2),
      selected = 1,
      inline = TRUE
    ),
    fileInput(
      'file1',
      h4('Upload Your Data'),
      accept = c(
        'text/csv',
        'text/comma-separated-values,text/plain',
        '.csv',
        '.xlsx'
      )),
    
    sidebarMenu(
      
      selectInput(inputId = "x", label = "Select x-axis Variable:",
                  choices = NULL),
      
      selectInput(inputId = "y", label = "Select y-axis Variable:",
                  choices = NULL),
      
      
      menuItem("Raw Data", tabName = "RawData",
               icon = icon("table")),
      
      menuItem("Data Summary", tabName = "DataSummary",
               icon = icon("calculator")),
      menuItem("Charts", tabName = "Charts",
               icon = icon("chart-bar"))
      
    )),
  dashboardBody(
    tabItems(
      tabItem( tabName = "RawData",
               fluidRow(
                 box(
                   title = "View Data", 
                   width = NULL,
                   status = "primary", 
                   solidHeader = TRUE,
                   collapsible = TRUE,
                   
                   DT::dataTableOutput('contents'))
                 
               )),
      tabItem(tabName = "DataSummary",
              
              box(verbatimTextOutput("summary"))
              
      ), 
      tabItem(tabName = "Charts",
              box(
                plotOutput('plot'))
              
      )
      
    ))
)

shinyServer <- function(input, output, session) {
  # Get the upload file
  myData <- reactive({
    req(input$file1)
    inFile <- input$file1
    if (is.null(inFile)) return(NULL)
    data <- read.csv(inFile$datapath, header = TRUE)
    data
  })
  
  output$contents <- DT::renderDataTable({
    DT::datatable(myData())       
  })
  
  observe({
    data <- myData()
    updateSelectInput(session, 'x', choices = names(data))
  }) 
  #gets the x variable name, will be used to change the plot legends
  xVarName <- reactive({
    input$x
  }) 
  
  observe({
    data <- myData()
    updateSelectInput(session, 'y', choices = names(data))
  }) 
  #gets the y variable name, will be used to change the plot legends
  yVarName <- reactive({
    input$y
  }) 
  
  output$summary <- renderPrint({
    summary(myData())
  })
  
  # This has not been placed anywhere; there is no uiOutput with id of select in your ui code
  # output$select <- renderUI({
  #   df <- myData()
  #   selectInput("variable", "Variable:",names(df))
  #   
  # })
  
  output$plot <- renderPlot({
    df <- myData()
    # df <- df[,input$variable] # no purpose
    ggplot(df, aes_string(x = input$x, y = input$y))+
      geom_line()
  })
}
shinyApp(shinyUI, shinyServer)

Thanks a lot, now it works as intended.
Much appreciated.

This topic was automatically closed 7 days after the last reply. New replies are no longer allowed.