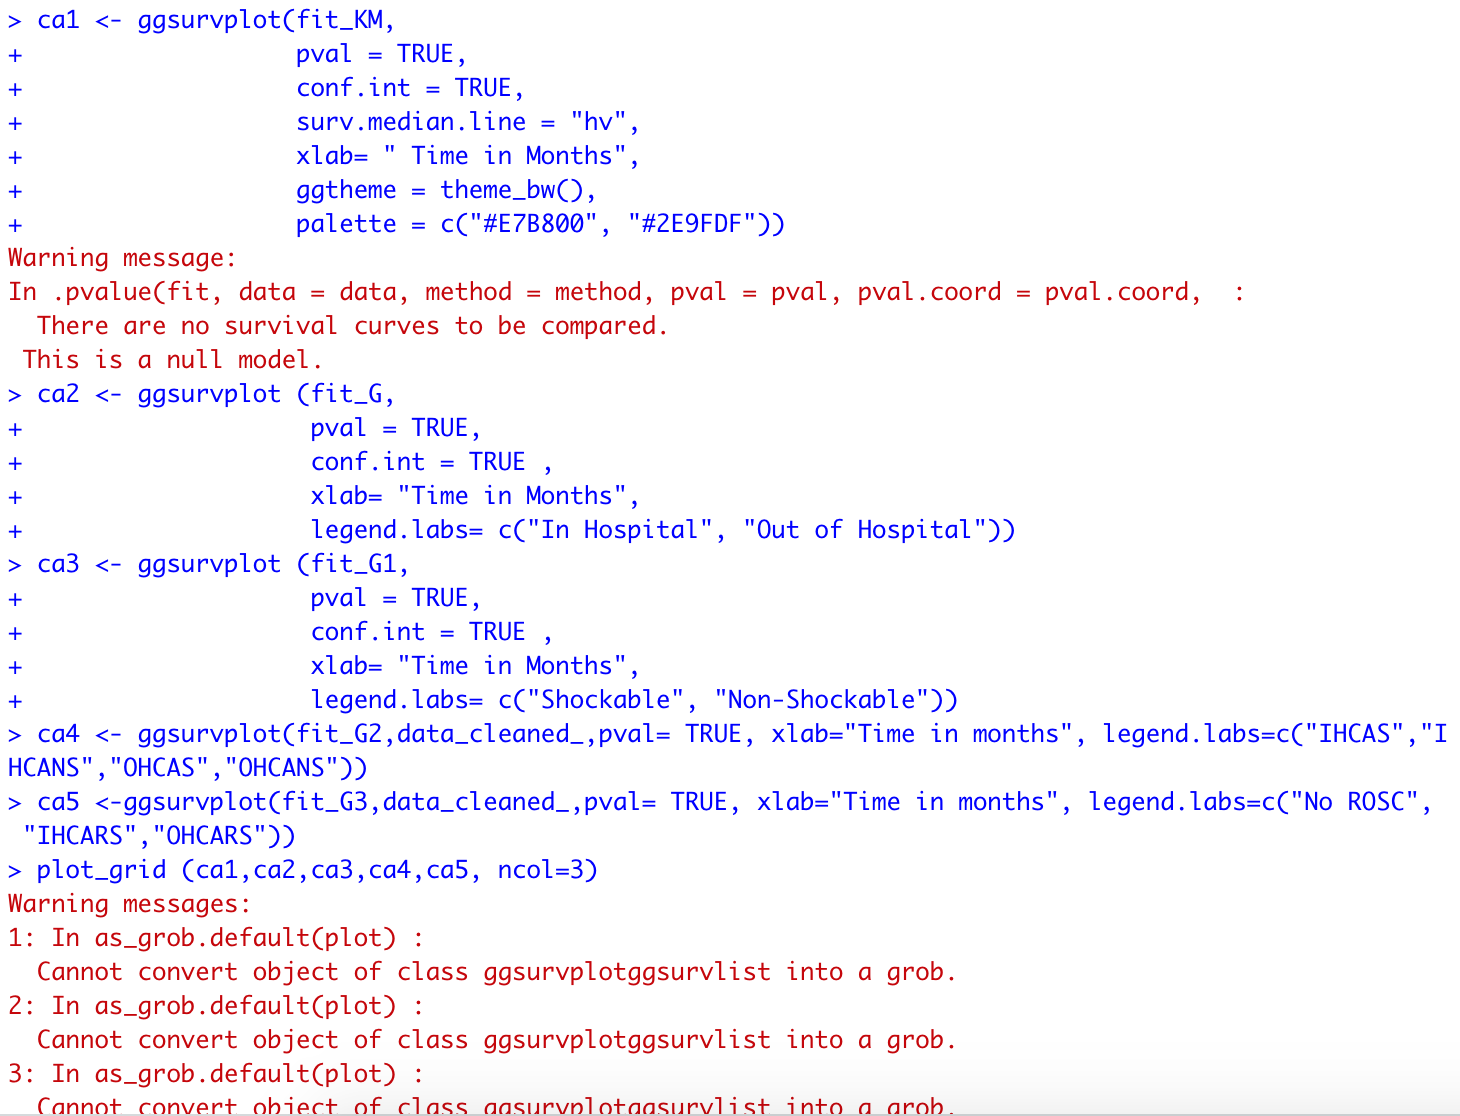
Hi! I am new to R. I seem to have a problem combining the survplot together and I keep on getting an error as seen in the picture and Im not sure if Im doing it right.
I think you need to look more closely at the documentation of survminer.
Look at ?ggsurvplot, you'll see the result is a list, and the ggplot object is in the plot element.
Try for example ca1$plot. You'll get a plot. If you arrange those $plot object, it will work better.
Also, survminer contains a arrange_ggsurvplots function to simplify what you are doing I think, by also graphing the table result.
Hope it helps.
Thank you so much! It does help a lot!
1 Like
This topic was automatically closed 7 days after the last reply. New replies are no longer allowed.