Hello!
I was wondering if anyone knew how I could restrict my volcano plot labeling to only the top 10 differentially expressed genes (aka, the ones with the smallest of p-values)?
#edgeR analysis

library(limma)
library(edgeR)
library(readxl)
library(dplyr)
library(stats4)
library(BiocGenerics)
library(AnnotationDbi)
library(BiocManager)
library(org.Hs.eg.db)
library(GO.db)
library(ggplot2)
library(ggrepel)


#call control, call another treatment
group <- factor(c(rep('HD1', 15), rep('HD2', 10)))
#Here it will not work unless you make C variable first and then do function
#to make DGE
C <- read_excel('R/HD1vsHD2.xlsx')

C <- C%>%
  {
    DGEList(counts = C[,c(3:27)],
            genes = C[, c('Geneid', 'Length')],
            group = group)
  }

design <- model.matrix(~group)
counts_keep <- filterByExpr(C,  min.count = 20)
counts_filter <- C[counts_keep, ]
counts_norm <- calcNormFactors(counts_filter)

plotMDS(counts_norm)

counts_filter <- estimateDisp(counts_norm, design)
fit <- glmQLFit(counts_filter,design)

#test variable creates an object that has the p value and log 2 fold change
test <- glmQLFTest(fit,coef= 2)


geneid <- test[["genes"]][["Geneid"]]
logFC <- test[["table"]][["logFC"]]
pvalue <- test[["table"]][["PValue"]]

df <- data.frame(geneid, logFC, pvalue)


####### volcano plot
options(ggrepel.max.overlaps = Inf)

#determine if genes are differentially expressed
df$diffexpressed <- "No"

#if log2Foldchange > 0.6 and pvalue < 0.05, set as "Up"
df$diffexpressed[df$logFC > 0.6 & df$pvalue < 0.05] <- "Up"

#if log2Foldchange < -0.6 and pvalue < 0.05, set as "Down"
df$diffexpressed[df$logFC < -0.6 & df$pvalue < 0.05] <- "Down"

#reorganize the df dataset for pvalue (small to big)
df %>% arrange(pvalue)

#top 10 genes and their pvalues
head(arrange(df,pvalue),10)$pvalue #for top 10 smallest pvalues

ggplot(df, aes(x = logFC, y = -log10(pvalue), col = diffexpressed, label = NA)) +
  geom_point() +
  coord_cartesian(ylim = c(0,28)) +
  theme_minimal() +
  scale_color_manual(values = c("purple", "grey", "orange")) +
  geom_vline(xintercept = c(-0.6, 0.6), col ="red") +
  geom_hline(yintercept = -log10(0.05), col ="red") +
  theme(text = element_text(size=10)) +
  labs(title = "???")
If I label all of my genes using label = geneid , then the volcano plot becomes illegible as all of the gene names take up the screen. So at the moment, I have label = NA in my ggplot so that no points are labeled:
ggplot(df, aes(x = logFC, y = -log10(pvalue), col = diffexpressed, label = NA)) + ...
Here is an image of the arranged df datat set where the pvalues are in ascending order, as well as the volcano plot produced!
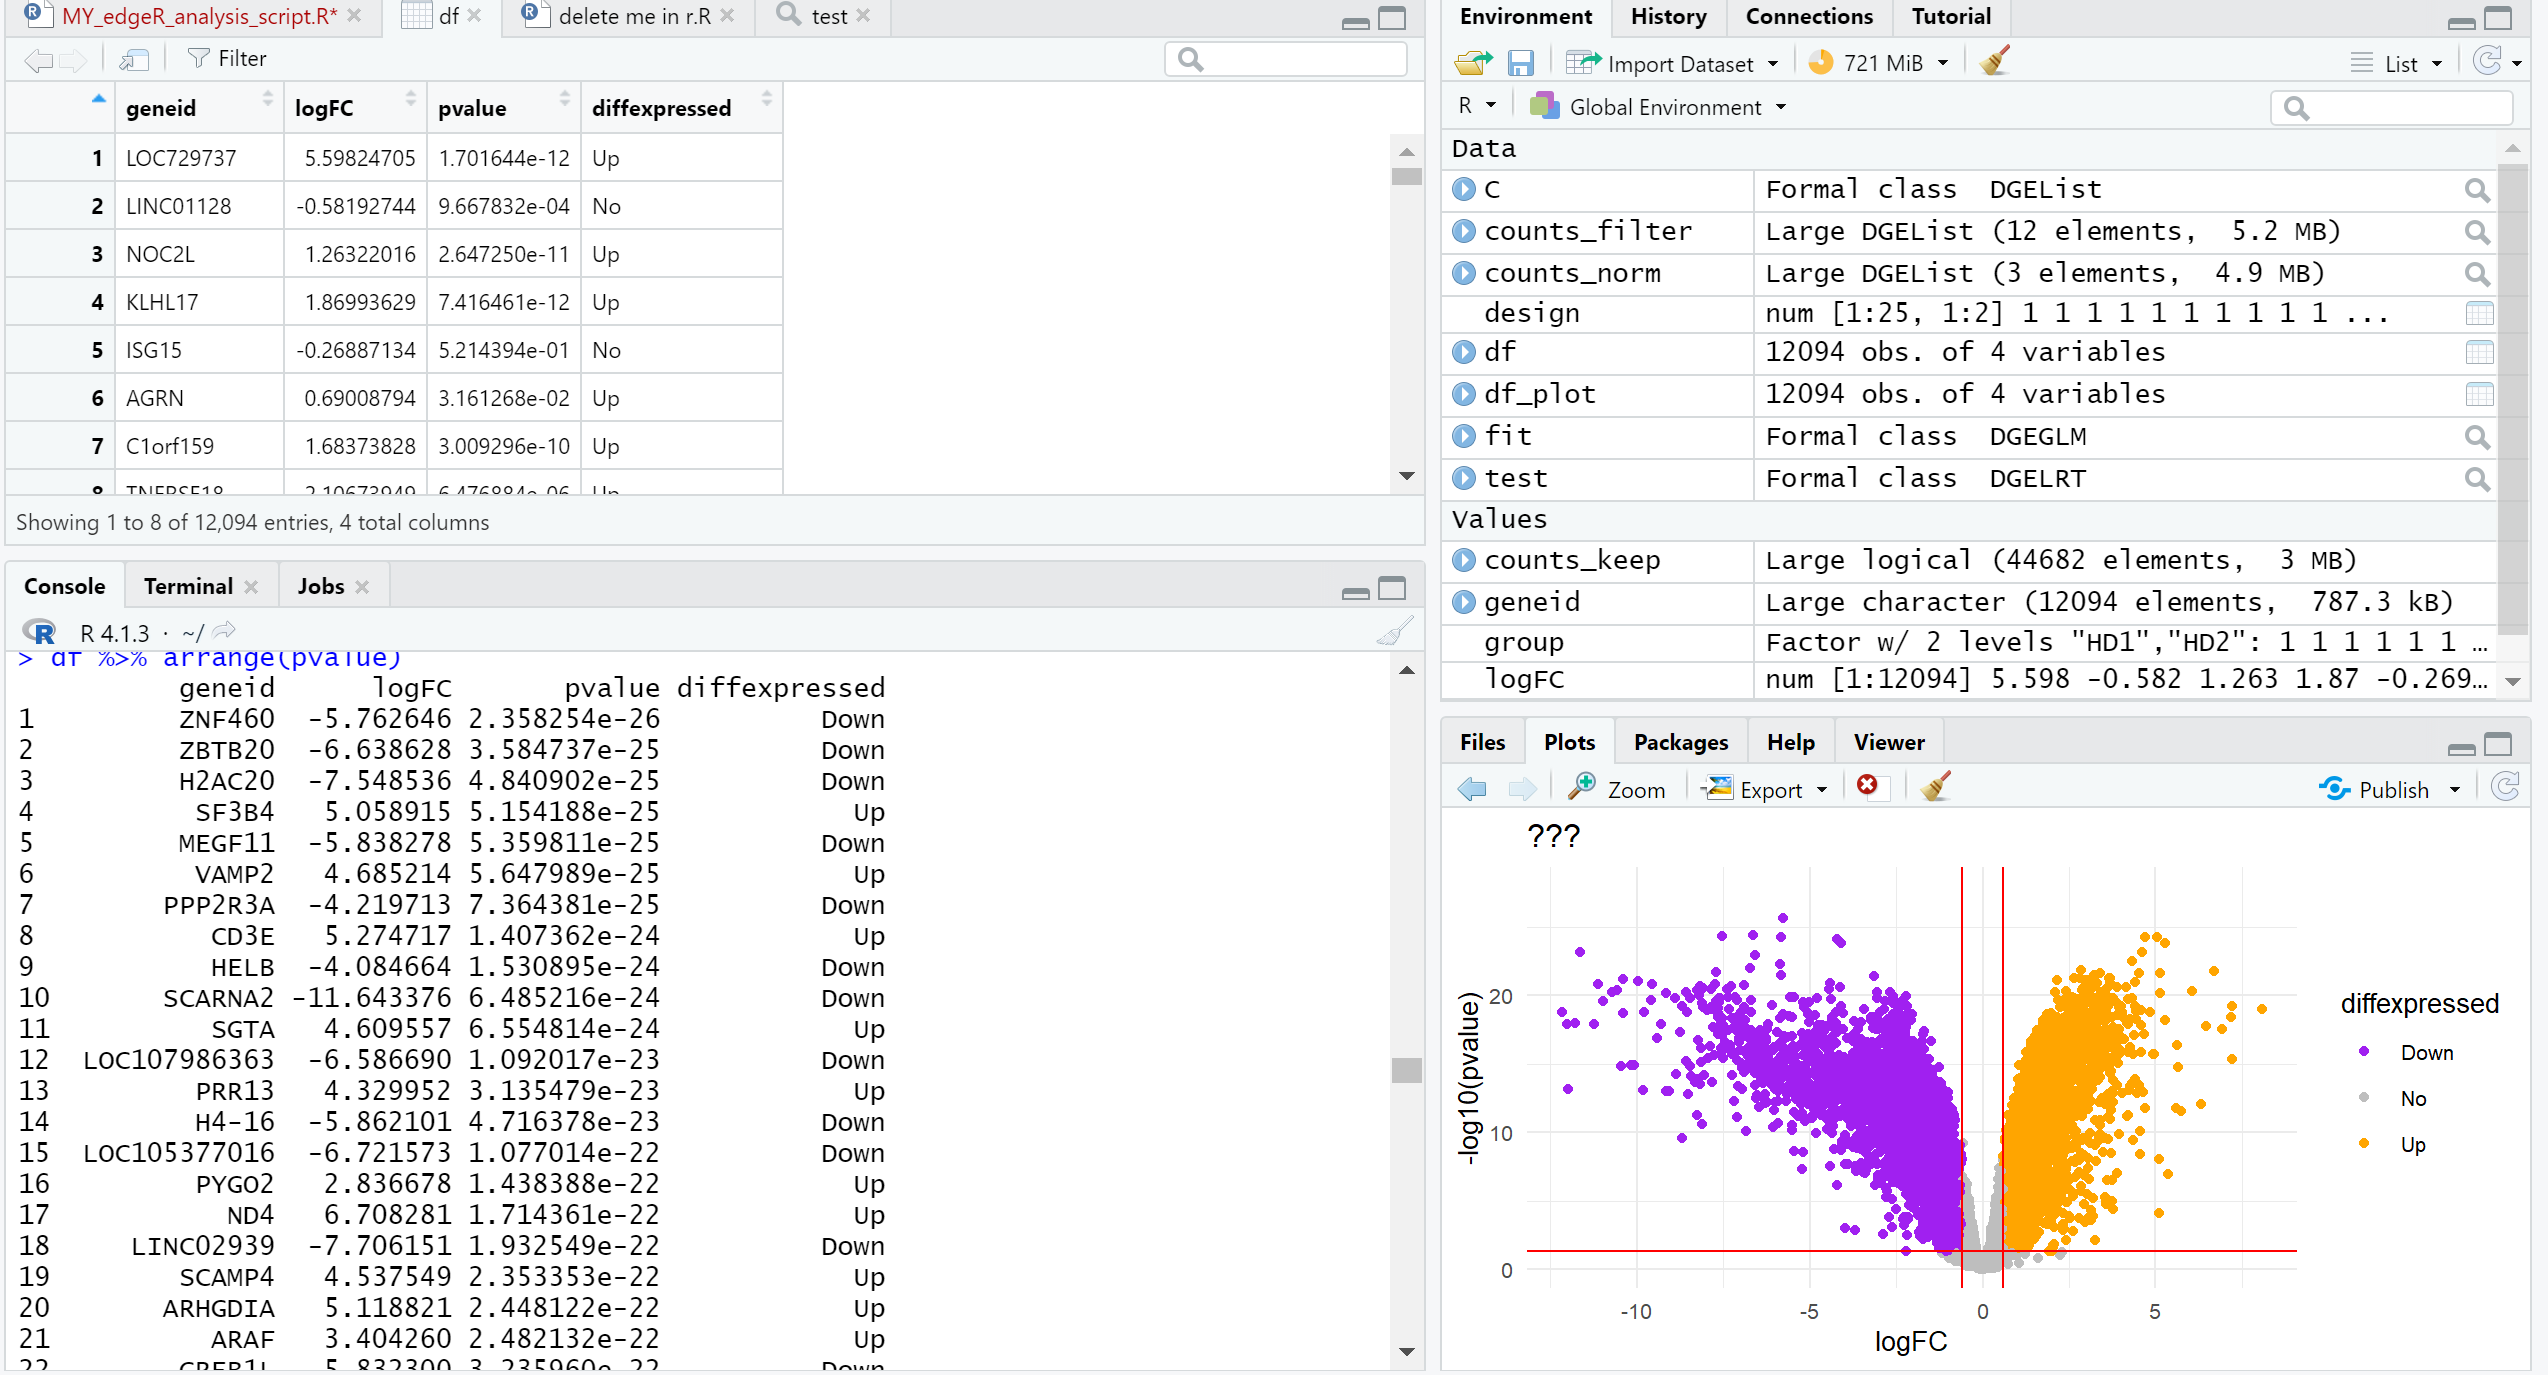
Any advice on how to label only the top 10 rows of that list present in the Console?
Thank you!