pipeable_plot <- function(data, formula) {
  plot(formula, data)
  # Add a "formula" attribute to data
  attr(data, "formula") <- formula
  invisible(data)
}

# From previous exercise
plt_dist_vs_speed <- cars %>%
  pipeable_plot(dist ~ speed)

# Examine the structure of the result
str(plt_dist_vs_speed)
Then just leave it out and look at the difference.
Don't be afraid to try out some things!
You indicated in another post that you are following a tutorial.
You will learn most by just doing.
library(magrittr)
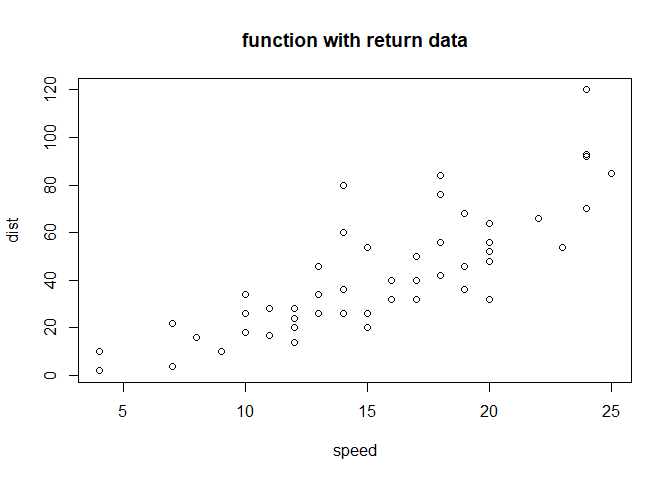
pipeable_plot <- function(data, formula) {
plot(formula, data,main='function with return data')
# Add a "formula" attribute to data
attr(data, "formula") <- formula
invisible(data)
}
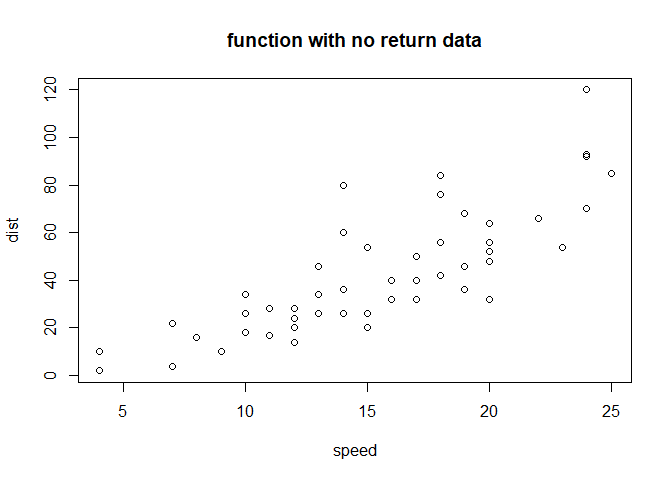
pipeable_plot2 <- function(data, formula) {
plot(formula, data,main='function with no return data')
# Add a "formula" attribute to data
# attr(data, "formula") <- formula
# invisible(data)
}
# Note I added 'str' here
plt_dist_vs_speed <- cars %>%
pipeable_plot(dist ~ speed) %>%
str()