Hello!
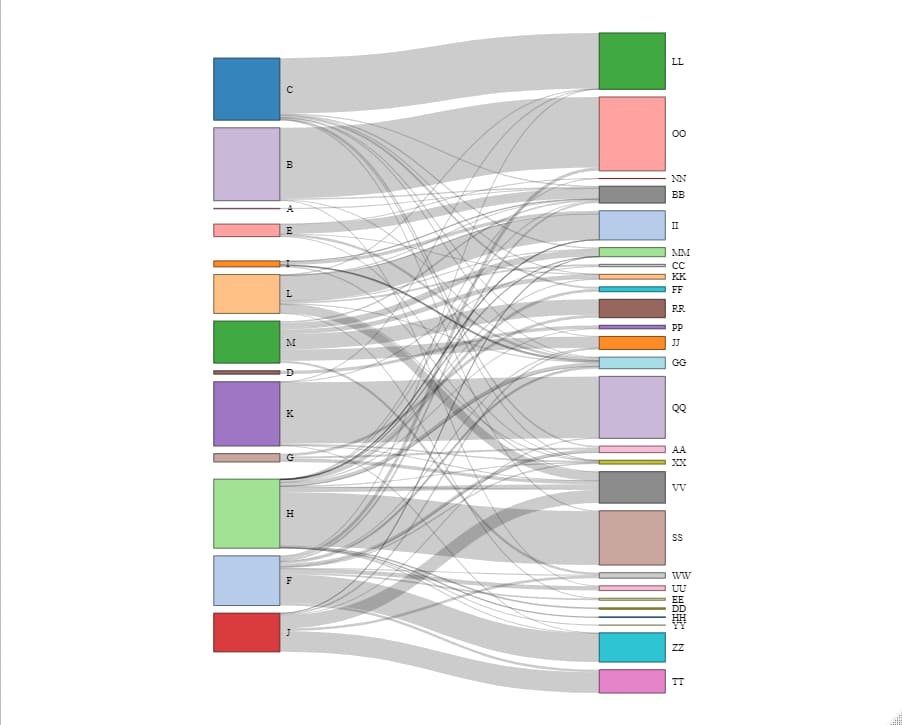
datosankey <- read.csv("https://docs.google.com/spreadsheets/d/e/2PACX-1vS45SekhiRvzq8PXATIpG9HjwqNBloVGBuey4Zmf7eM0CPTFKGeT7ZnB_KaSKml_gPF5gzt5nHFbQUs/pub?output=csv ")
datosankey$target <- paste(datosankey$target, " ", sep="")
nodes <- data.frame(name=c(as.character(datosankey$source), as.character(datosankey$target)) %>% unique())
sankeyNetwork(Links = datosankey, Nodes = nodes,
system
May 16, 2023, 6:18pm
2
This topic was automatically closed 42 days after the last reply. New replies are no longer allowed.
I think his example is nice. Question: how can one assign the "25" as a value to B2 so that is shows up?
You could use htmlwidgets::onRender() to inject some JavaScript to add the value to the node label...
library(dplyr)
library(networkD3)
library(htmlwidgets)
#>
#> Attaching package: 'htmlwidgets'
#> The following object is masked from 'package:networkD3':
#>
#>     JS

datosankey <-read.csv("https://docs.google.com/spreadsheets/d/e/2PACX-1vS45SekhiRvzq8PXATIpG9HjwqNBloVGBuey4Zmf7eM0CPTFKGeT7ZnB_KaSKml_gPF5gzt5nHFbQUs/pub?output=csv")

datosankey$target <- paste(datosankey$target, " ", sep = "")

nodes <- data.frame(name = unique(c(datosankey$source, datosankey$target)))

datosankey$IDsource = match(datosankey$source, nodes$name) - 1
datosankey$IDtarget = match(datosankey$target, nodes$name) - 1

sankey <-
  sankeyNetwork(
    Links = datosankey,
    Nodes = nodes,
    Source = "IDsource",
    Target = "IDtarget",
    Value = "value",
    NodeID = "name",
    sinksRight = FALSE,
    nodeWidth = 60,
    fontSize = 9,
    nodePadding = 7
  )

onRender(
  x = sankey,
  jsCode = '
    function(el, x){
      d3.select(el).selectAll(".node text")
        .text(d => d.name + " (" + d3.format("(.0f")(d.value) + ")");
    }
  '
)