meitei
1
Hello,
I found the following code for spatial plot.
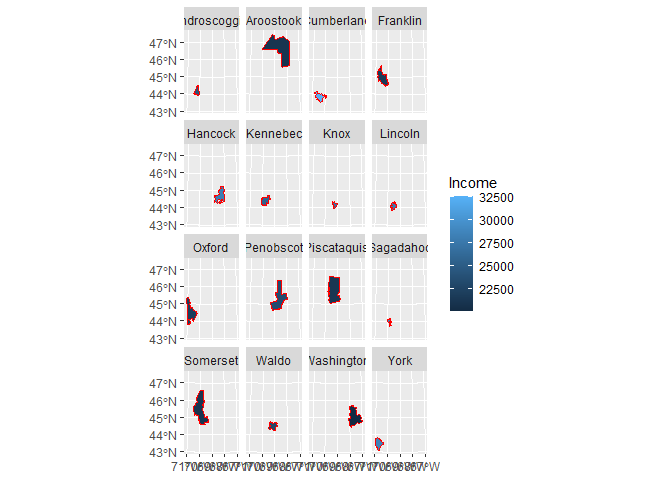
The following code shows 16 maps. How can I make it into either 4 rows or columns?
Thank you
library(sf)
library(tmap)
library(ggplot2)
load(url("https://github.com/mgimond/Spatial/raw/main/Data/Sample1.RData"))
p=ggplot(data = s.sf, aes(fill = Income)) +
  geom_sf(col = "red")
p+ facet_grid(.~ NAME)
Use ggplot2::facet_wrap().
library(sf)
#> Linking to GEOS 3.9.1, GDAL 3.2.1, PROJ 7.2.1
library(ggplot2)
load(url("https://github.com/mgimond/Spatial/raw/main/Data/Sample1.RData"))
p=ggplot(data = s.sf, aes(fill = Income)) +
  geom_sf(col = "red")
p+ facet_wrap(.~ NAME, ncol = 4)

Created on 2021-12-28 by the reprex package (v2.0.1)
4 Likes
system
Closed
3
This topic was automatically closed 7 days after the last reply. New replies are no longer allowed.
If you have a query related to it or one of the replies, start a new topic and refer back with a link.
