How to insert a matrix as an image in rmarkdown

I am using rmarkdown to generate a word report in which I want to show the matrix with complete multiple columns. But since there are too many columns, I am turning it into an image to display, however, the generated image is not displaying fully because of the window limitations. I can only save this image and then insert it. And also need to set the size of each image.

data<-t(data.frame(rep(1:100),nrow=10,ncol=10))
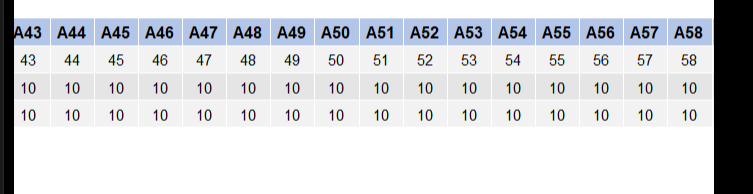
ggpubr::ggtexttable(data, cols = c(paste0("A",rep(1:100))),theme = ggpubr::ttheme(colnames.style = ggpubr::colnames_style(fill = "#B4C6E7")) )

Is there any way to directly turn the matrix into an image, similar to a screenshot

Patchwork together with GridExtra can handle this very nicely.
tableGrob() will generate grob out of matrix (it can also handle dataframes) and that grob can be displayed by patchwork.

library(patchwork)
library(gridExtra)

mat <- matrix(1:21, 3,7)
colnames(mat) <- paste0("colname_", 1:ncol(mat))
rownames(mat) <- paste0("rowname_", 1:nrow(mat))

p <- tableGrob(mat)
wrap_plots(p)

Note that patchwork can combine these grobs as if they are standard ggplots.

library(ggplot2)
p1 <- ggplot(mtcars) + geom_point(aes(mpg, disp))
p1/p

Read more here The Composer of Plots • patchwork

Thank you for your reply.
But what I need is similar to what excel does to copy a table into a picture.
I want to show my data matrix inside rmarkdown. But since there are too many columns. office word can't put down so many columns, so I want to convert this matrix into a picture and insert it into markdown like excel to picture so that I can show multi-column form.
I tried the following code and found that tableGrob+wrap_plots has no difference with ggtexttable, they both need me to reset the graphic width otherwise only part of it will be displayed.

if having image of table is an option for you than excel can definitely handle at least 50 cols and more than 200 rows. if you have more than that, perhaps you can think about an alternative?

OK, my alternative looks bad, I split the multi-column table then output multiple tables with no more than 8 columns each, adjusting the column widths according to the content. You know, it's a pain in the ass.

flextable(data[,c(1:8)],cwidth = c(1,0.7,0.3,0.7,0.8,0.8,0.5,0.7))%>%
 fontsize(size=9,part = "all")%>%
  bg(bg = "blue",part = "header" )
fpar("",fp_p = fp_par(text.align  = "center",line_spacing=2))
flextable(data[,c(9:13)],cwidth = c(1,1.2,1.2,1.2,1.2))%>%
  fontsize(size=9,part = "all")%>%
  bg(bg = "blue",part = "header" )
fpar("",fp_p = fp_par(text.align  = "center",line_spacing=2))
flextable(data[,c(14:18)],cwidth = c(1,1.2,1.2,1.2,1.2))%>%
   fontsize(size=9,part = "all")%>%
  bg(bg = "blue",part = "header" )
fpar("",fp_p = fp_par(text.align  = "center",line_spacing=2))
flextable(data[,c(19:23)],cwidth = c(1,1.2,1.2,1.2,1.2))%>%
  fontsize(size=9,part = "all")%>%
  bg(bg = "blue",part = "header" )
fpar("",fp_p = fp_par(text.align  = "center",line_spacing=1))

And I realized I'm all about repetition over repetition over repetition. This is not consistent with the rmarkdown kernel

It works as one-time solution, but its cumbersome. I think it would be most efficient to just include image exported from excel (You can control images pretty well in Rmarkdown. If you are interested Quarto has nice documentation about figure layout and can output word as well).

P.S. you can use kableExtra if you want to generate scrollable table in your document. But that will only work for html.

Happy Chinese New Year! Thanks for your reply.I did some processing to turn some of the redundant code into a function final output.

FitFlextableToPage <- function(ft, pgwidth = 5.7){
  ft_out <- ft %>% autofit()
  ft_out <- width(ft_out, width = dim(ft_out)$widths*pgwidth /(flextable_dim(ft_out)$widths))
  return(ft_out)
}

This is one of the better ways I've seen from other sites to handle this, no longer needing to set the number of cells per cell. I wish the flextable package would support adapting the content to the window like this. Other table formats can also be set in the setup custom function.You just need to split the multi-column table.

This topic was automatically closed 45 days after the last reply. New replies are no longer allowed.

If you have a query related to it or one of the replies, start a new topic and refer back with a link.