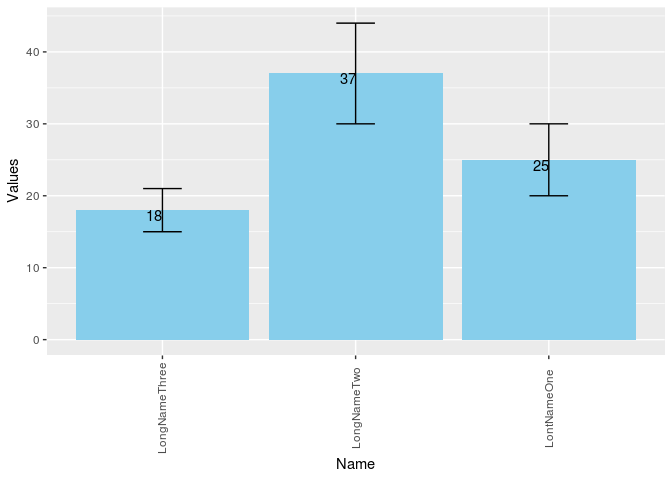
I was searching for some help with R as I am a complete novice and this helped with my problem of not knowing how to input my own "complete" data, as opposed to a list of 1s such as in a matrix. The code (reprex?) that I have copied below produces a bar graph with three bars of corresponding values and names.
Though this solved part of my issue I wondered if there may be a way to do something similar putting my own numbers for my standard error over these bars? For example on bar 1 have a standard error ranging from 17-32?
Fundamentally, I am looking to input my own already calculated standard errors as error bars, instead of R wanting to calculate the error bars for itself, so is there a way that I can specify what my error bars should be?
Many thanks
library(ggplot2)
DF <- data.frame(Name = c("LontNameOne", "LongNameTwo", "LongNameThree"),
                 Values = c(25, 37, 18))
ggplot(DF, aes(Name, Values)) + geom_col(fill = "skyblue") +
  geom_text(aes(label = Values, vjust = 1)) +
  theme(axis.text.x = element_text(angle = 90, hjust = 0.5, vjust = 0.5))