Hi @technocrat this is my representative data that has been used for the plot generation:
final <- data.frame(
  stringsAsFactors = FALSE,
              name = c("RIBOSYN2-PWY__flavin_biosynthesis_I_(bacteria_and_plants)",
                       "PWY-6385__peptidoglycan_biosynthesis_III_(mycobacteria)",
                       "PWY-6151__S-adenosyl-L-methionine_cycle_I",
                       "PWY-6387__UDP-N-acetylmuramoyl-pentapeptide_biosynthesis_I_(meso-diaminopimelate_containing)",
                       "PWY-6700__queuosine_biosynthesis",
                       "PEPTIDOGLYCANSYN-PWY__peptidoglycan_biosynthesis_I_(meso-diaminopimelate_containing)",
                       "PWY-6386__UDP-N-acetylmuramoyl-pentapeptide_biosynthesis_II_(lysine-containing)",
                       "PWY-5667__CDP-diacylglycerol_biosynthesis_I",
                       "PWY0-1319__CDP-diacylglycerol_biosynthesis_II",
                       "PWY-6122__5-aminoimidazole_ribonucleotide_biosynthesis_II",
                       "PWY-6277__superpathway_of_5-aminoimidazole_ribonucleotide_biosynthesis",
                       "PWY-6163__chorismate_biosynthesis_from_3-dehydroquinate",
                       "TRPSYN-PWY__L-tryptophan_biosynthesis",
                       "PANTOSYN-PWY__pantothenate_and_coenzyme_A_biosynthesis_I",
                       "GLYCOCAT-PWY__glycogen_degradation_I_(bacterial)",
                       "P161-PWY__acetylene_degradation",
                       "FUC-RHAMCAT-PWY__superpathway_of_fucose_and_rhamnose_degradation",
                       "P108-PWY__pyruvate_fermentation_to_propanoate_I",
                       "PWY-7328__superpathway_of_UDP-glucose-derived_O-antigen_building_blocks_biosynthesis",
                       "TCA__TCA_cycle_I_(prokaryotic)",
                       "PWY-6901__superpathway_of_glucose_and_xylose_degradation","PWY66-400__glycolysis_VI_(metazoan)",
                       "FUCCAT-PWY__fucose_degradation",
                       "PRPP-PWY__superpathway_of_histidine,_purine,_and_pyrimidine_biosynthesis",
                       "PWY-7234__inosine-5'-phosphate_biosynthesis_III",
                       "TRPSYN-PWY__L-tryptophan_biosynthesis",
                       "PWY-6122__5-aminoimidazole_ribonucleotide_biosynthesis_II",
                       "PWY-6277__superpathway_of_5-aminoimidazole_ribonucleotide_biosynthesis",
                       "RIBOSYN2-PWY__flavin_biosynthesis_I_(bacteria_and_plants)",
                       "PWY-6163__chorismate_biosynthesis_from_3-dehydroquinate",
                       "PWY-5667__CDP-diacylglycerol_biosynthesis_I",
                       "PWY0-1319__CDP-diacylglycerol_biosynthesis_II",
                       "PANTOSYN-PWY__pantothenate_and_coenzyme_A_biosynthesis_I",
                       "RIBOSYN2-PWY__flavin_biosynthesis_I_(bacteria_and_plants)",
                       "PWY-6386__UDP-N-acetylmuramoyl-pentapeptide_biosynthesis_II_(lysine-containing)",
                       "RIBOSYN2-PWY__flavin_biosynthesis_I_(bacteria_and_plants)",
                       "PANTOSYN-PWY__pantothenate_and_coenzyme_A_biosynthesis_I",
                       "PWY-6385__peptidoglycan_biosynthesis_III_(mycobacteria)",
                       "PWY-6387__UDP-N-acetylmuramoyl-pentapeptide_biosynthesis_I_(meso-diaminopimelate_containing)","PWY-6700__queuosine_biosynthesis",
                       "PWY-6151__S-adenosyl-L-methionine_cycle_I",
                       "PWY0-1319__CDP-diacylglycerol_biosynthesis_II",
                       "PWY-5667__CDP-diacylglycerol_biosynthesis_I",
                       "PEPTIDOGLYCANSYN-PWY__peptidoglycan_biosynthesis_I_(meso-diaminopimelate_containing)",
                       "PWY-6387__UDP-N-acetylmuramoyl-pentapeptide_biosynthesis_I_(meso-diaminopimelate_containing)",
                       "PWY-6385__peptidoglycan_biosynthesis_III_(mycobacteria)",
                       "PANTOSYN-PWY__pantothenate_and_coenzyme_A_biosynthesis_I",
                       "PEPTIDOGLYCANSYN-PWY__peptidoglycan_biosynthesis_I_(meso-diaminopimelate_containing)","PWY-5667__CDP-diacylglycerol_biosynthesis_I",
                       "PWY0-1319__CDP-diacylglycerol_biosynthesis_II"),
          estimate = c(0.492903365186722,
                       0.490116714405755,0.470681520902659,0.465726944992238,
                       0.461786439528495,0.455469435286562,0.449174326308655,
                       0.433755737833203,0.433670791448977,0.412009484469875,
                       0.412009484469875,0.409849212159568,0.407818381473059,
                       0.406187518931948,-0.405573831841341,-0.407806403622317,
                       -0.418351108232386,-0.419107645158175,-0.420781760133428,
                       -0.441930843508614,-0.444723954813865,-0.451224756237618,
                       -0.504642907784859,-0.515843696383127,-0.523823484265933,
                       1.01203740887784,0.860911808112254,0.860911808112254,
                       0.782824395343453,0.779871038531055,0.763412247455786,
                       0.763412247455786,0.744965434413444,0.735086809796288,
                       0.733132943355509,0.731855318166865,0.730523378560539,
                       0.728356885227315,0.694487466356475,0.694335496605963,
                       0.68469489116557,0.680753784497535,0.680732580641012,
                       0.668909750729078,0.665107737526883,0.662352062210176,
                       0.643767077562848,0.640204416487105,0.639460661647805,
                       0.637911093993277),
                se = c(0.10858902830706,
                       0.101375498952004,0.101193730594653,0.101213265518358,
                       0.101165178275411,0.101149604926044,0.101114528367103,
                       0.101177617463096,0.101176196339295,0.10102421433221,
                       0.10102421433221,0.100910703206783,0.101046445558438,
                       0.12265509469116,0.10486856029419,0.103267024648877,0.100867566762125,
                       0.11467836793049,0.10790947678297,0.100997454994136,
                       0.101684644439116,0.103275688295495,0.101358559584742,
                       0.101485340026678,0.131050876787633,0.12672527384678,
                       0.0911987727585976,0.0911987727585976,0.0473284627336248,
                       0.120947206065826,0.120594420271743,0.120594420271743,
                       0.120207965256539,0.12000489747134,0.119965054342127,
                       0.0890575546896603,0.0468935746714197,
                       0.0890043416222531,0.119198789457309,0.0466102635462743,
                       0.119011209638725,0.0883056120686039,0.0883053113523379,
                       0.0881390968551948,0.0880862640207957,0.118593197976584,
                       0.0877953030586674,0.118192523540133,0.0462081105569776,
                       0.0461972348759043),
           country = c("metaanalysis","metaanalysis",
                       "metaanalysis","metaanalysis","metaanalysis",
                       "metaanalysis","metaanalysis","metaanalysis","metaanalysis",
                       "metaanalysis","metaanalysis","metaanalysis",
                       "metaanalysis","metaanalysis","metaanalysis","metaanalysis",
                       "metaanalysis","metaanalysis","metaanalysis",
                       "metaanalysis","metaanalysis","metaanalysis","metaanalysis",
                       "metaanalysis","metaanalysis","Swedish","Kazakh","Kazakh",
                       "Japanese","Swedish","Swedish","Swedish","Swedish",
                       "Swedish","Swedish","Kazakh","Japanese","Kazakh",
                       "Swedish","Japanese","Swedish","Kazakh","Kazakh",
                       "Kazakh","Kazakh","Swedish","Kazakh","Swedish","Japanese",
                       "Japanese")
)
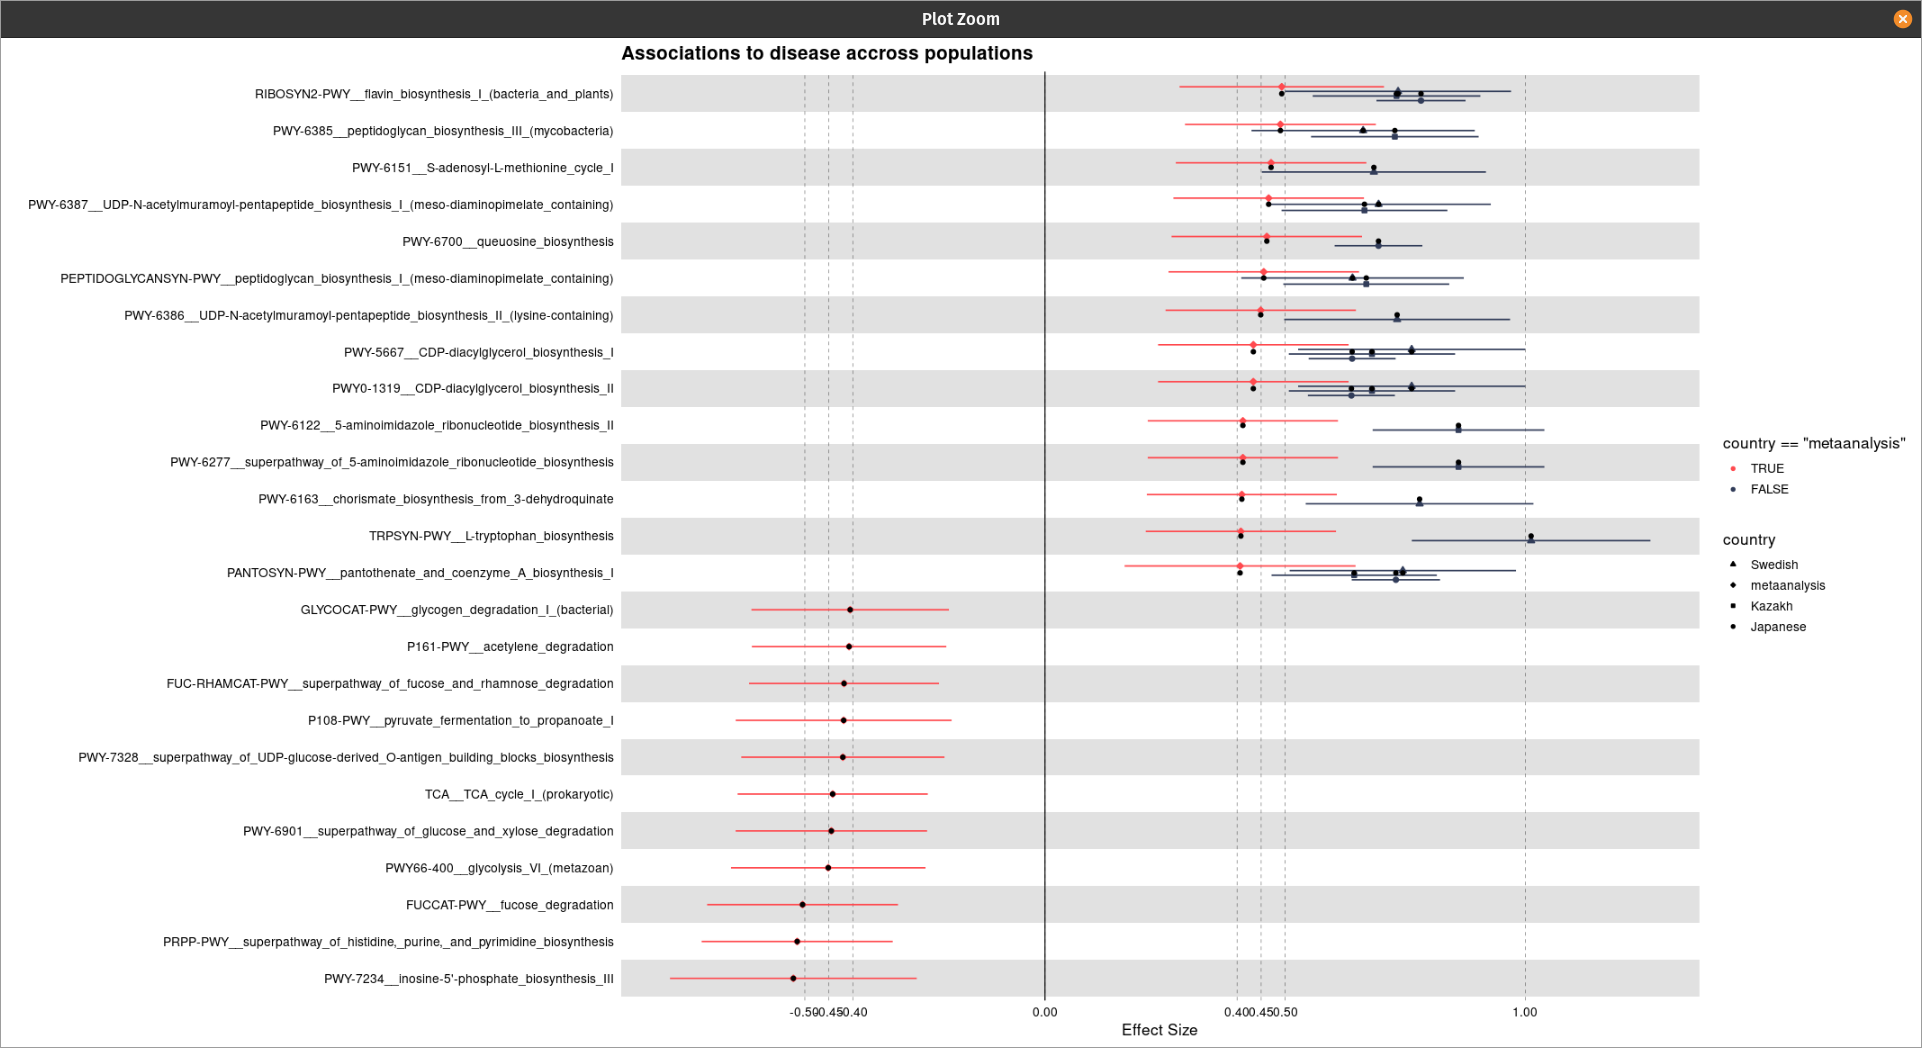
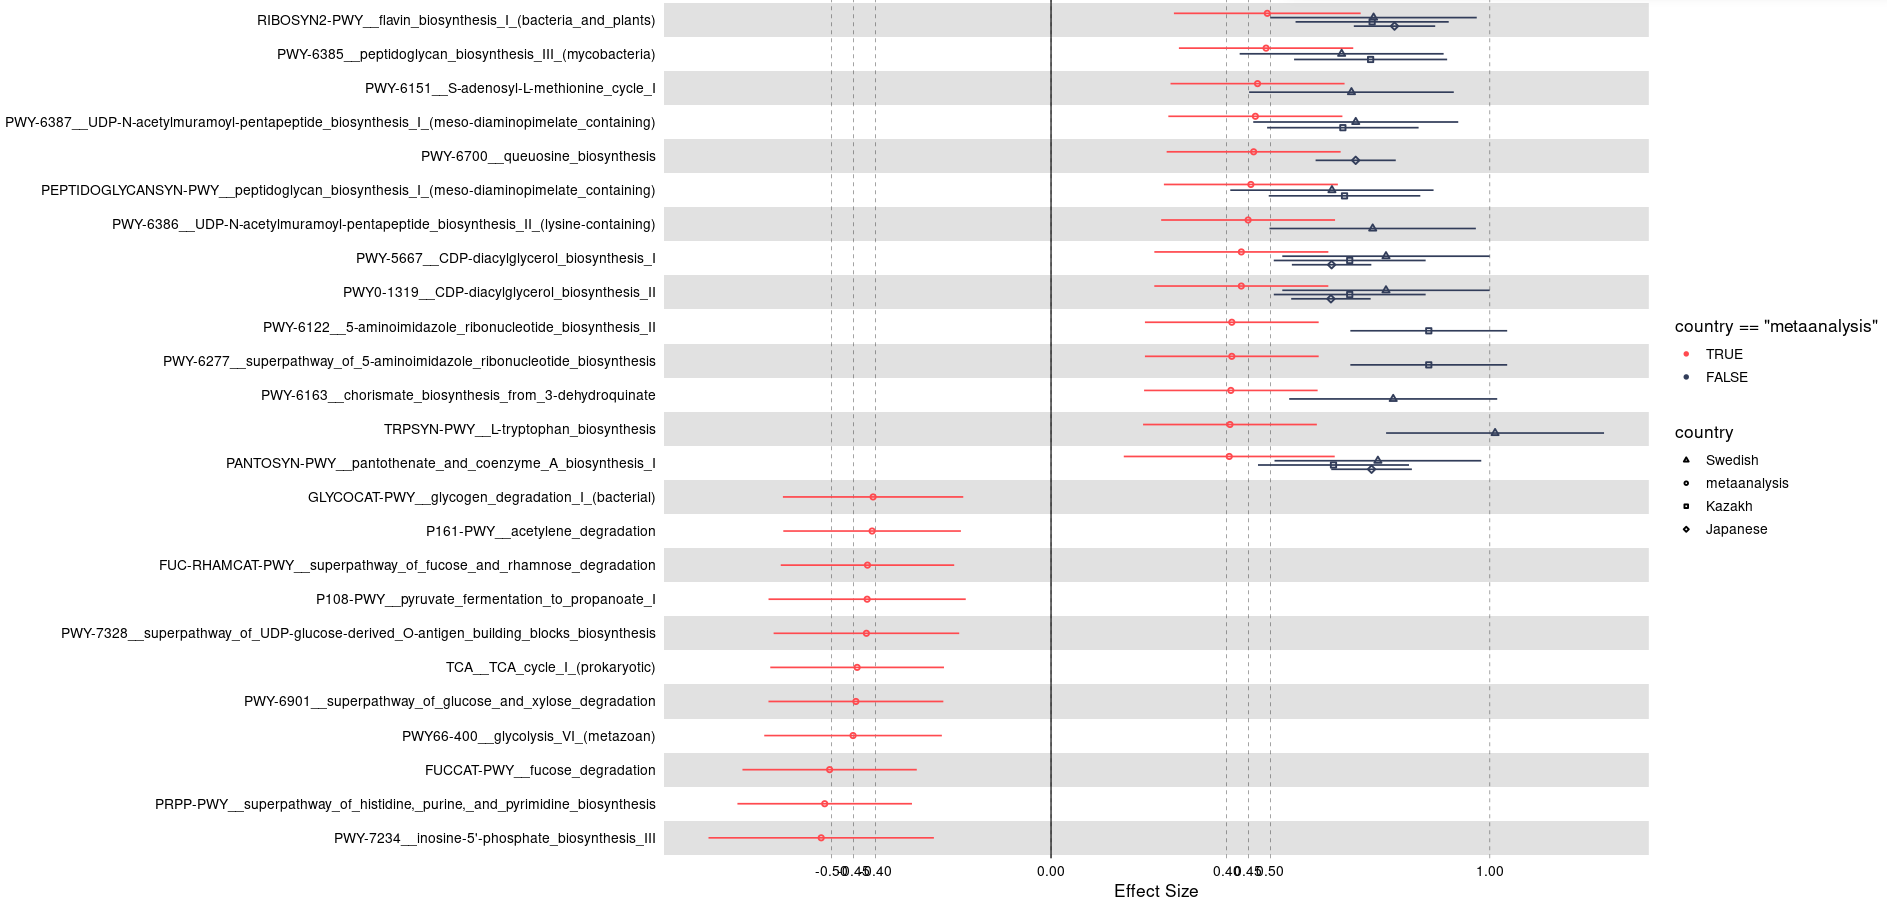
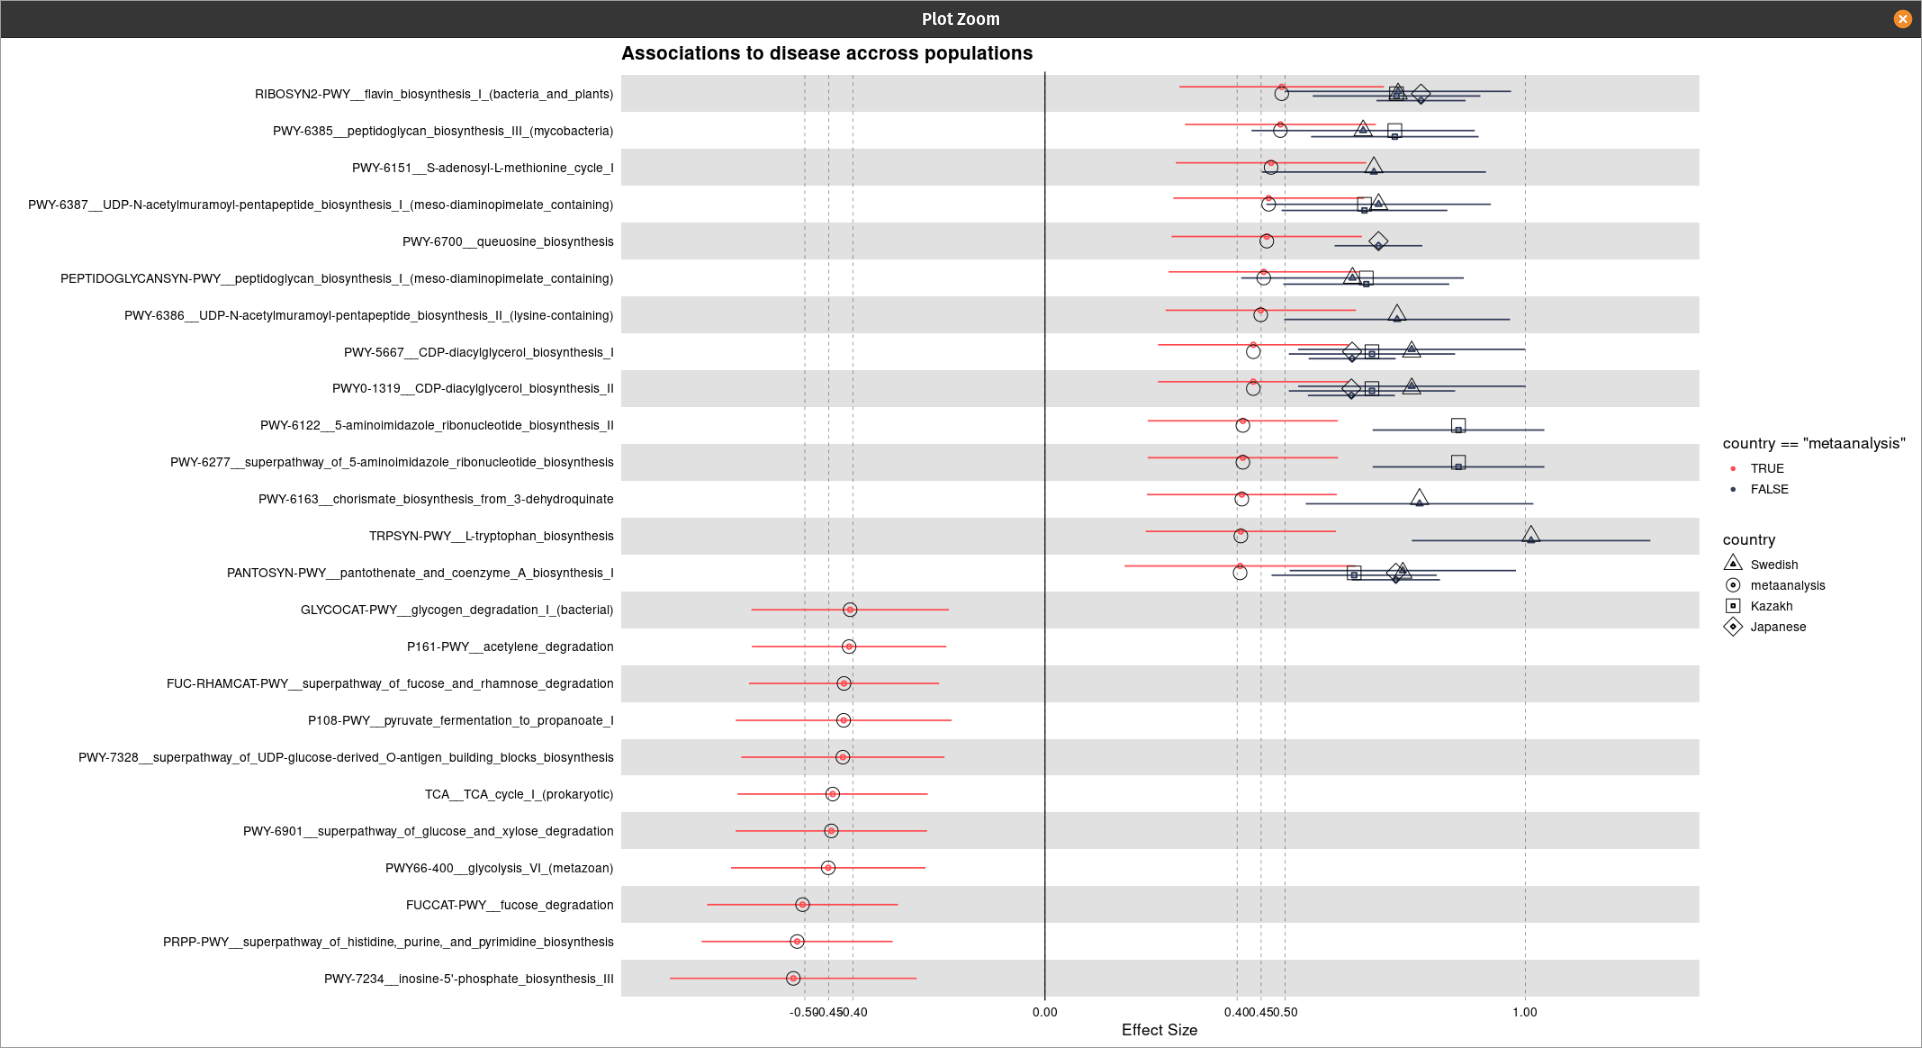
One thing I have noticed is when I am using the following code the shapes are coming twice: one with normal default size and one with its three times size:
# Forestplot
my_plot <- forestplot(
  df = final,
  estimate = estimate,
  logodds = FALSE,
  colour = country=="metaanalysis",
  shape = country,
  title = "Associations to disease accross populations",
  xlab = "Effect Size",
  #xlim = c(-1.5, 1.5),
  xtickbreaks = c(-1.0, -0.5, -0.45, -0.4, 0, 0.4, 0.45,0.5, 1.0)
)+
  # You may also want to add a manual shape scale to mark meta-analysis with a
  # diamond shape
  geom_point(aes(shape = final$country), size = 5)+
  scale_shape_manual(
    values = c(5L, 0L, 1L, 2L, 8L, 19L, 4L, 3L))
Do you get any idea from this?
Thanks,
DC7