Hellohttps://drive.google.com/file/d/1Kr7TM_lnGadFuqWJutzBvTJg-8CyrdTP/view
library("FSA")
DG4<- read.csv("Farooq1.csv")
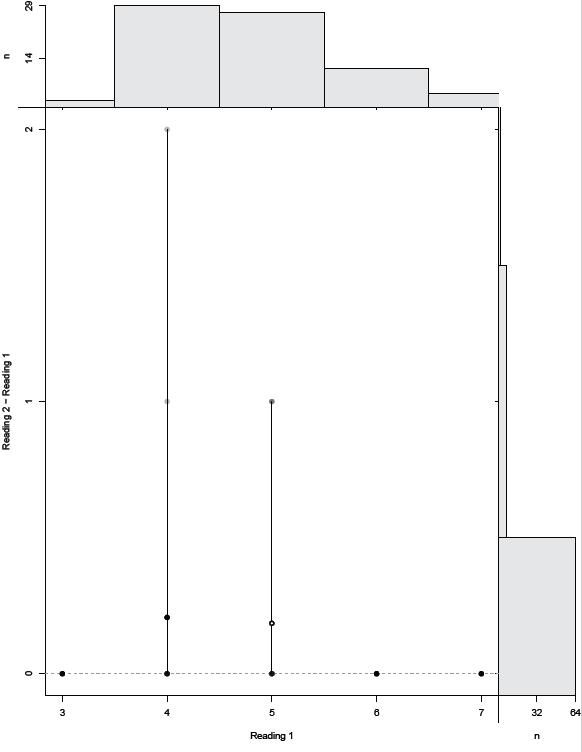
DG1 <- ageBias(Dorsal_fin1~Dorsal_fin2,data=DG4,
nref.lab="Reading 2",ref.lab="Reading 1")
plot(DG1,difference=TRUE,xHist=TRUE,yHist=TRUE,
col.CIsig="black",show.pts=TRUE)
Hi,
plot(DG1,difference=TRUE,xHist=TRUE,yHist=TRUE,
But only cex.lab works means the font size of y-axis and x-axis titles change only.
Here is a reproducible example of the data:
library(FSA)
DavoWW
April 13, 2020, 1:46pm
4
Hi @umarkhandurrani ,
help("plot.ageBias")
shows all the arguments for plotting this type of graphic.cex.pts= argument to get larger points:
library(FSA)
data(WhitefishLC)

ab1 <- ageBias(scaleC~otolithC,data=WhitefishLC,
               nref.lab="Scale Age",ref.lab="Otolith Age")

plot(ab1, xHist=TRUE, yHist=TRUE,
     col.CIsig="black", cex.main=2, cex.lab=1.5, cex.axis=1, show.pts=TRUE,
     cex.pts=2)
I noted that if the axis labels were made too large then the graph did not fit on the plotting page. You can adjust the margin settings if you really need the axis labels at cex.lab=2
HTH
1 Like
[quote="DavoWW, post:4, topic:61071"]
system
April 20, 2020, 2:06pm
6
This topic was automatically closed 7 days after the last reply. New replies are no longer allowed.