I wanted to create some movement models for some satellite tag data for a project of mine, but all my graphs are very small and hard to see
Here is the code I used:
move_Shark5 <- move(x=Shark5BBMM$Longitude, y=Shark5BBMM$Latitude,
              time=Shark5BBMM$Date,
              location.error=Shark5BBMM$Error_radius,
              proj=CRS("+proj=longlat +ellps=WGS84 +datum=WGS84"),
              data=Shark5BBMM, animal=Shark5BBMM$DeployID)
move_Shark5
Which gave me the following:
Warning: Unknown or uninitialised column: citation.Warning: Setting row names on a tibble is deprecated.class : Move
features : 312
extent : -118.2998, -118.0283, 33.574, 33.9012 (xmin, xmax, ymin, ymax)
crs : +proj=longlat +datum=WGS84 +no_defs
variables : 4
names : Date, Latitude, Longitude, Error_radius
min values : 1696580285, 33.574, -118.2998, 84
max values : 1697456696, 33.9012, -118.0283, 21196
timestamps : 2023-10-06 01:18:05 ... 2023-10-16 04:44:56 Time difference of 10 days (start ... end, duration)
sensors : unknown
indiv. data : DeployID
indiv. value: 253347
date created: 2024-11-05 19:09:27
Shark5.prj <- spTransform(move_Shark5, CRSobj="+proj=aeqd +ellps=WGS84" ,center=TRUE)
ts <- median(timeLag(move_Shark5,"mins"))
dBB.Shark5 <- brownian.bridge.dyn(Shark5.prj, ext=3.1, dimSize=200, location.error="Error_radius",time.step=ts/15)
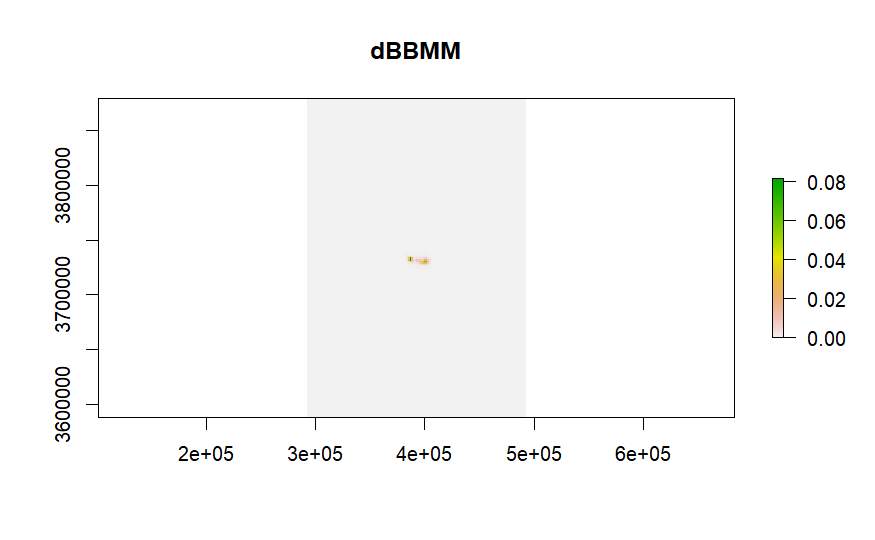
plot(dBB.Shark5, main="dBBMM")
Which gave me this:
I tried initially to decrease the ext=, but I couldn't go lower than 3.1 without showing me the following:
Error in .local(object, raster, location.error = location.error, ext = ext, :
Lower x grid not large enough, consider extending the raster in that direction or enlarging the ext argument
Is there any way to make the graph bigger?
Thanks