Hi ggplot2 experts
How do I identify the optimal height and width to save this patchwork plot?
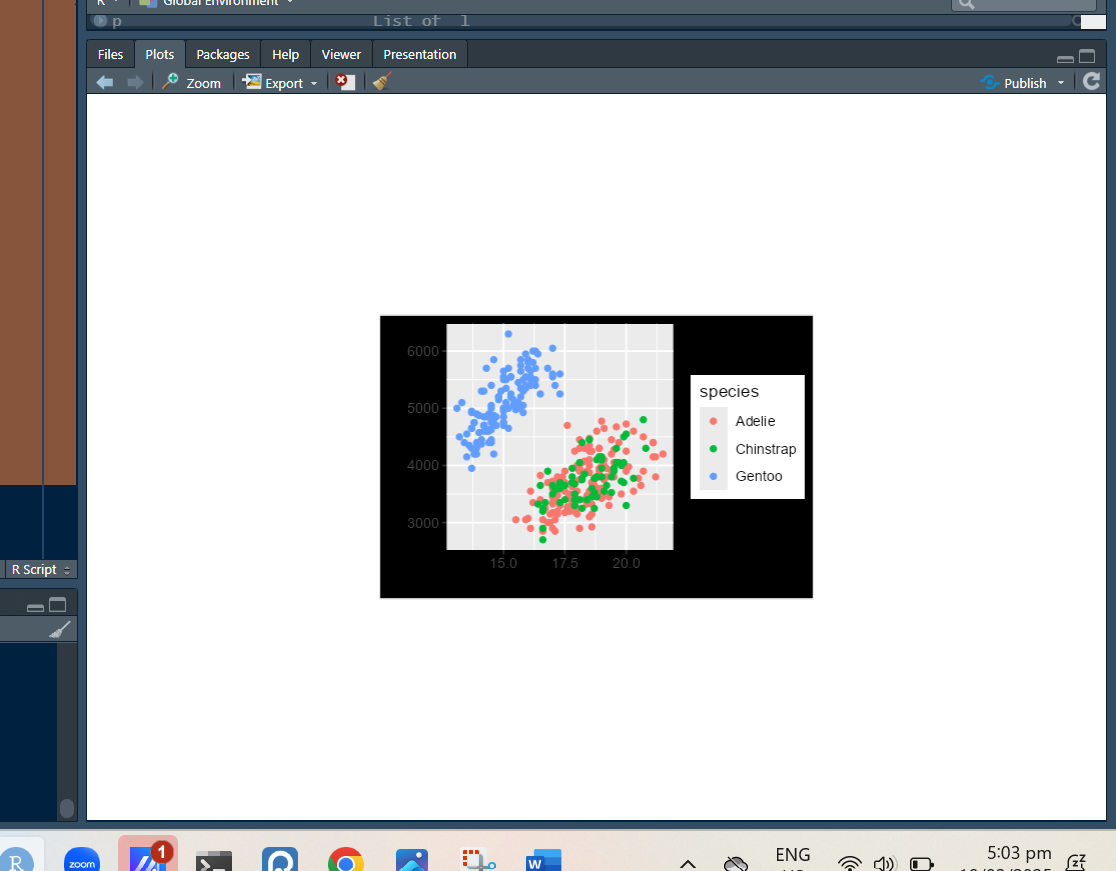
My objective is to work out how to specify a fixed panel size for a plot using patchwork::plot_layout as below - and then save it with the optimal dimensions (i.e. not excess whitespace in the example below)
library(tidyverse)
library(palmerpenguins)
library(patchwork)

p <- penguins |>
  drop_na(sex) |>
  ggplot() +
  geom_point(
    aes(x = bill_depth_mm,
        y = body_mass_g,
        colour = species),
  ) +
  patchwork::plot_layout(
    widths = unit(50, "mm"),
    heights = unit(50, "mm"),
  ) +
  theme(plot.background = element_rect(fill = "black"))

p

ggsave(
  filename = "temp.png",
  # width = 110, #guessing
  # height = 70, #guessing
  units = "mm",
)
You can get the dimensions of the plot pane with grDevices::dev.size() or ggplot2:::plot_dim()
1 Like
I think this is the way
library(ggplot2) #dev version
library(palmerpenguins)
library(patchwork)

theme_set(  theme(panel.widths = rep(unit(50, "mm"), times = 100)) +
              theme(panel.heights = rep(unit(50, "mm"), times = 100)))

p <- penguins |>
  drop_na(sex) |>
  ggplot() +
  geom_point(
    aes(x = bill_depth_mm,
        y = body_mass_g,
        colour = species),
  ) +
  theme(plot.background = element_rect(fill = "black"))

p

b <- ggplotGrob(p)
w <- sum(grid::convertWidth(b$widths, "mm", TRUE))
h <- sum(grid::convertHeight(b$heights, "mm", TRUE))

ggsave(
  plot = p,
  filename = "temp.png",
  height = h,
  width = w,
  units = "mm",
)
system
March 26, 2025, 10:16pm
4
This topic was automatically closed 7 days after the last reply. New replies are no longer allowed.