Dear R users,
I'm working on the dataset, and trying to get the peak values of y. In the dataframe df1, the y column includes 120 values, but I do not know how to separate each value with comma when export the data.
df1= data.frame(x=1:120,
y='0.000404607994364647
0.000418386229955128
0.000430794394524755
0.000441608763817604
0.000450720069991295
0.000458353928139761
0.000465244320438098
0.000472605442408119
0.000481836517062748
0.000494031258256718
0.000509477897425229
0.000527386888743664
0.000546053806503485
0.000563536347150758
0.000578694693557497
0.000592184934692638
0.000606880432664763
0.00062740434643328
0.000658951780340787
0.000706022263900694
0.000771695560505854
0.000857665701641296
0.000964821690647073
0.00109410977624778
0.00124762020201182
0.00142985018853286
0.00164871137836403
0.00191549532233234
0.00224333357803463
0.00264484132738258
0.00313097018738546
0.00371357432026318
0.00441311650708302
0.00527051763162742
0.00635951029446201
0.00779442118237125
0.0097289184514785
0.0123436051467147
0.0158230846458223
0.0203248591277636
0.0259430773877464
0.0326716119103998
0.0403751637620159
0.0487822072022065
0.0575125639221519
0.0661386623990792
0.0742571414246157
0.0815347852470562
0.0877087303679977
0.0925592583028204
0.0958964121231122
0.097577846789136
0.0975299735518198
0.0957428778093581
0.0922662141274413
0.0872674196185096
0.0811466237435986
0.0745892159235215
0.0684282888234455
0.0633408656175527
0.0595754289702118
0.0569149855310436
0.0549012076098515
0.0531548543217289
0.0515892280330073
0.0504152091574836
0.0499599635705786
0.0504031217012216
0.0515799825745852
0.0529930988557304
0.0540733795338386
0.0545753160201401
0.0548889928851148
0.0560788146361983
0.0595912907883012
0.0667366977351586
0.0781688004268402
0.0935992678733076
0.111863211025667
0.131261468491735
0.14996894361554
0.16630408902095
0.178792397549176
0.186142519356196
0.187370254991816
0.182238791895045
0.171908697734763
0.159376822267072
0.149232179773896
0.14661852192979
0.15582462684655
0.179167102876311
0.216598366309568
0.26603216591513
0.324083541154487
0.386820517224485
0.450113246364987
0.509323652377758
0.558573294272359
0.590463672842883
0.597264437175175
0.573745920439652
0.520380960986617
0.444758790690755
0.359750166225963
0.278987238175495
0.21206887381186
0.162091637731931
0.12651426193784
0.100279095709724
0.0790468365289463
0.0608671439409344
0.0459482418843583
0.0353311402777704
0.0295872989249962
0.0282323900120659
0.0298985530326881
0.0328961840601709
0.0357555698838089
0.0375239368848331')
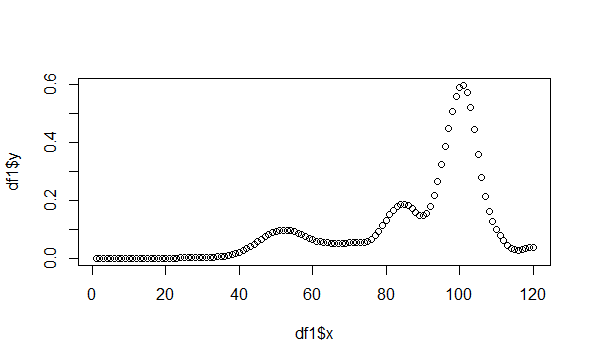
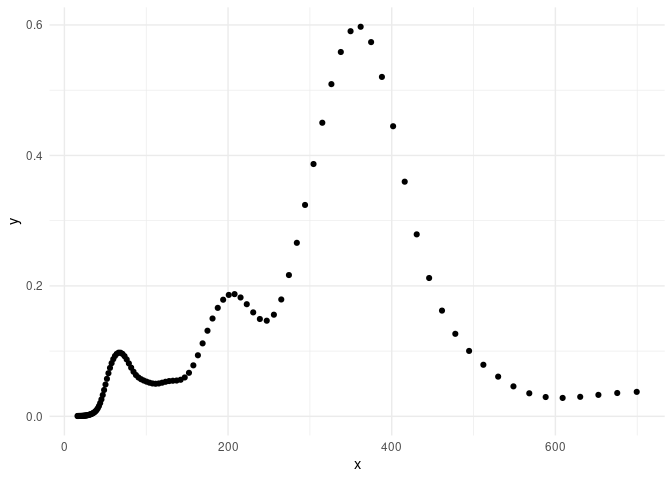
plot(df1$x,df1$y)
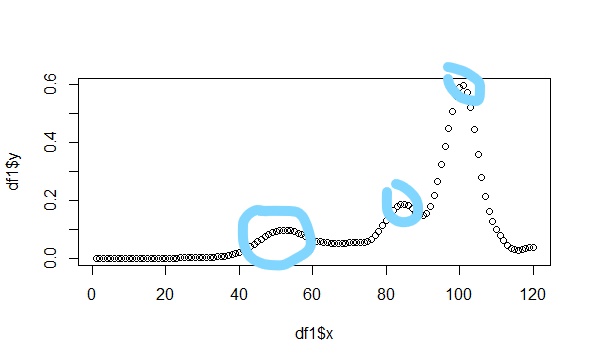
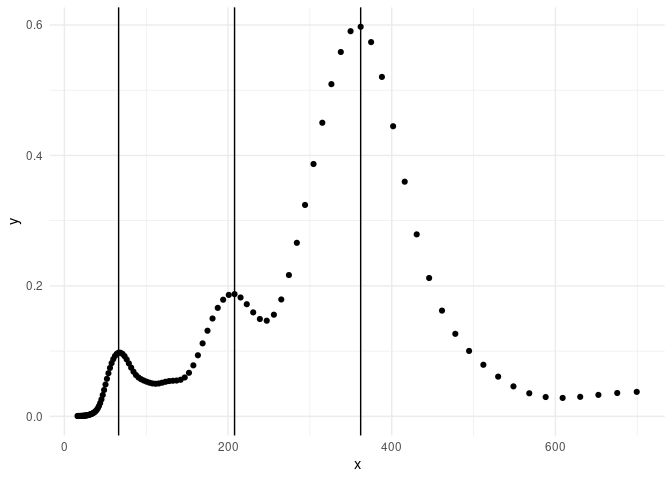
Anyway, the output figure should be like this. There are three peak values of y, how to get the peak values and the corresponding three x values? Thanks for your help.