Looks to me like you were not using a data.frame, can you share a reprex? Check that it's really a data.frame with class(). From your screenshot, it looks like a matrix, you can convert it with as.data.frame().
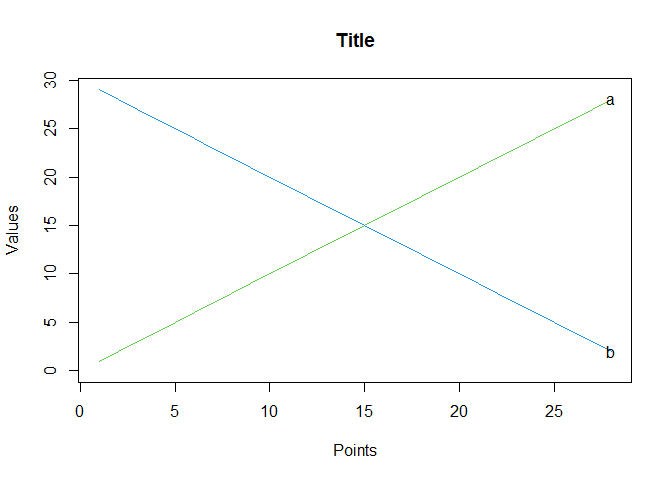
For example, it works with this made-up data:
dataframe <- data.frame(a = 1:28,
                        b = 29:2)

plot(NULL, ylab="Values", xlab="Points",
     main="Title",
     xlim=c(1,28), ylim=c(0.0,29))

lapply(seq_along(dataframe),
       function(i, all_cols, all_names){
         v <- all_cols[[i]]
         name_v <- all_names[[i]]

         c=8
         if(v[1]>v[14] && v[14]>v[28]){ c=4 }
         if(v[1]<v[14] && v[14]<v[28]){ c=3 }
         if(v[1]>v[14] && v[14]<v[28]){ c=2 }
         if(v[1]<v[14] && v[14]>v[28]){ c=5 }
         lines(seq(1,28),v,col=c)
         text(28,v[28],labels=c(name_v),col=1)
       },
       all_cols = dataframe,
       all_names = names(dataframe))
#> [[1]]
#> NULL
#>
#> [[2]]
#> NULL
Created on 2023-08-18 with reprex v2.0.2