I don't think it is possible with apply(): the vector that is passed to the function is not named. That can be seen by running:
apply(dataframe,2,function(v){
  message("v:", print(v))
  message("names:", names(v))

})
you will see that the content of v gets printed properly, but the names are empty.
Instead, we can rely on the fact that a data.frame is a list of columns, so apply(dataframe , 2, FUN) is the same thing as lapply(dataframe, FUN), or what is practical in out case, the same thing as purrr::map(dataframe, FUN) ({purrr} is a tidyverse package, so it's likely you already it).
In that case, we can easily use the imap() or iwalk() variants that pass the names:
purrr::iwalk(dataframe,function(v, name_v){
c=8
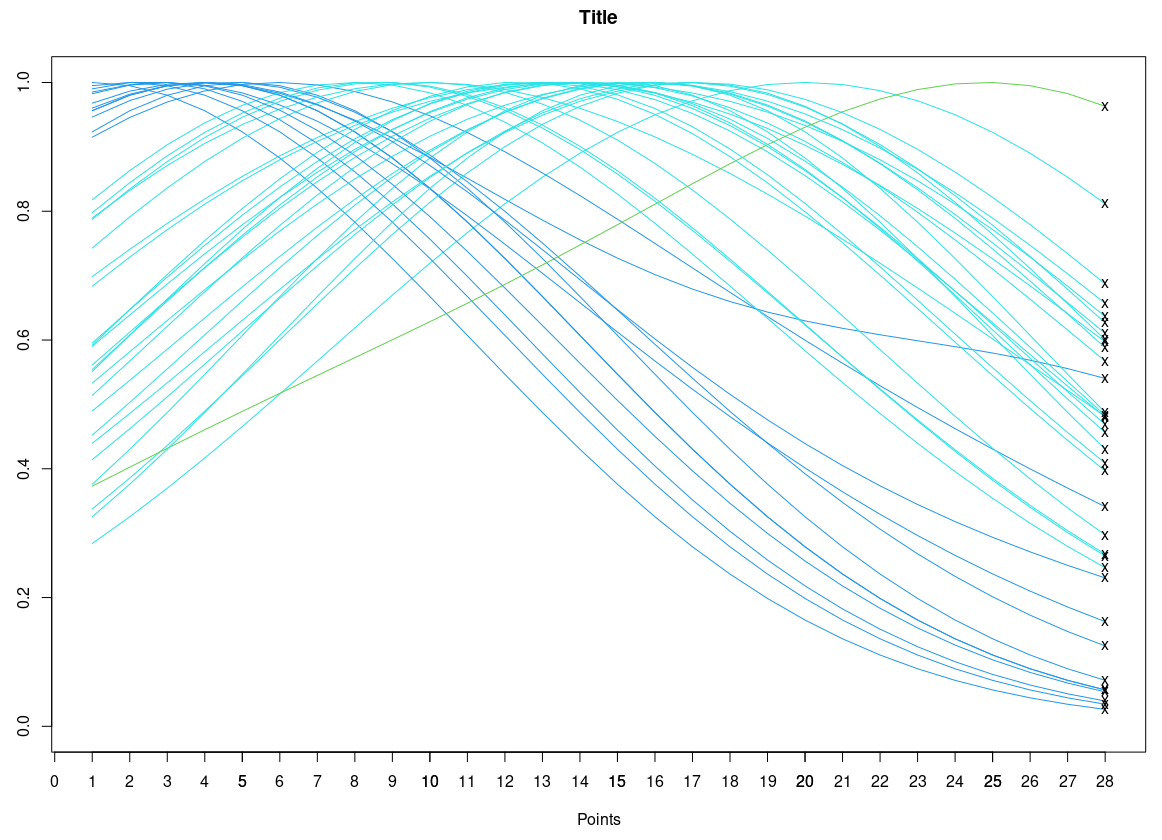
if(v[1]>v[14] && v[14]>v[28]){ c=4 }
if(v[1]<v[14] && v[14]<v[28]){ c=3 }
if(v[1]>v[14] && v[14]<v[28]){ c=2 }
if(v[1]<v[14] && v[14]>v[28]){ c=5 }
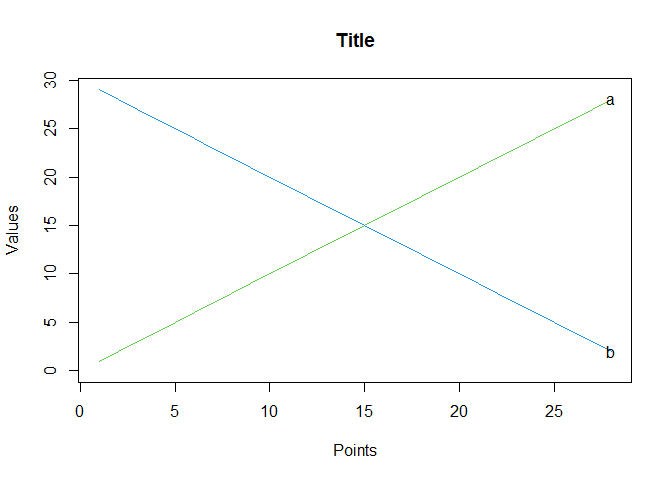
lines(seq(1,28),v,col=c)
text(28,v[28],labels=c(name_v),col=1)
})
If you want to stay with base R, you can do it with lapply() by looping on the column index, and passing all columns and all names as additional arguments:
lapply(seq_along(dataframe),
       function(i, all_cols, all_names){
         v <- all_cols[[i]]
         name_v <- all_names[[i]]

         c=8
         if(v[1]>v[14] && v[14]>v[28]){ c=4 }
         if(v[1]<v[14] && v[14]<v[28]){ c=3 }
         if(v[1]>v[14] && v[14]<v[28]){ c=2 }
         if(v[1]<v[14] && v[14]>v[28]){ c=5 }
         lines(seq(1,28),v,col=c)
         text(28,v[28],labels=c(name_v),col=1)
       },
       all_cols = dataframe,
       all_names = names(dataframe))