I have a geographic sf tibble with a variable for area, and about 40 rows. I want to group or split the tibble according to area, unify each group, and then be able to plot the unified areas' borders, with a text label for each unified area. The desired plot will have just 11 combined, larger areas, with a single text label for each.
So far in my attempts, I can either get:
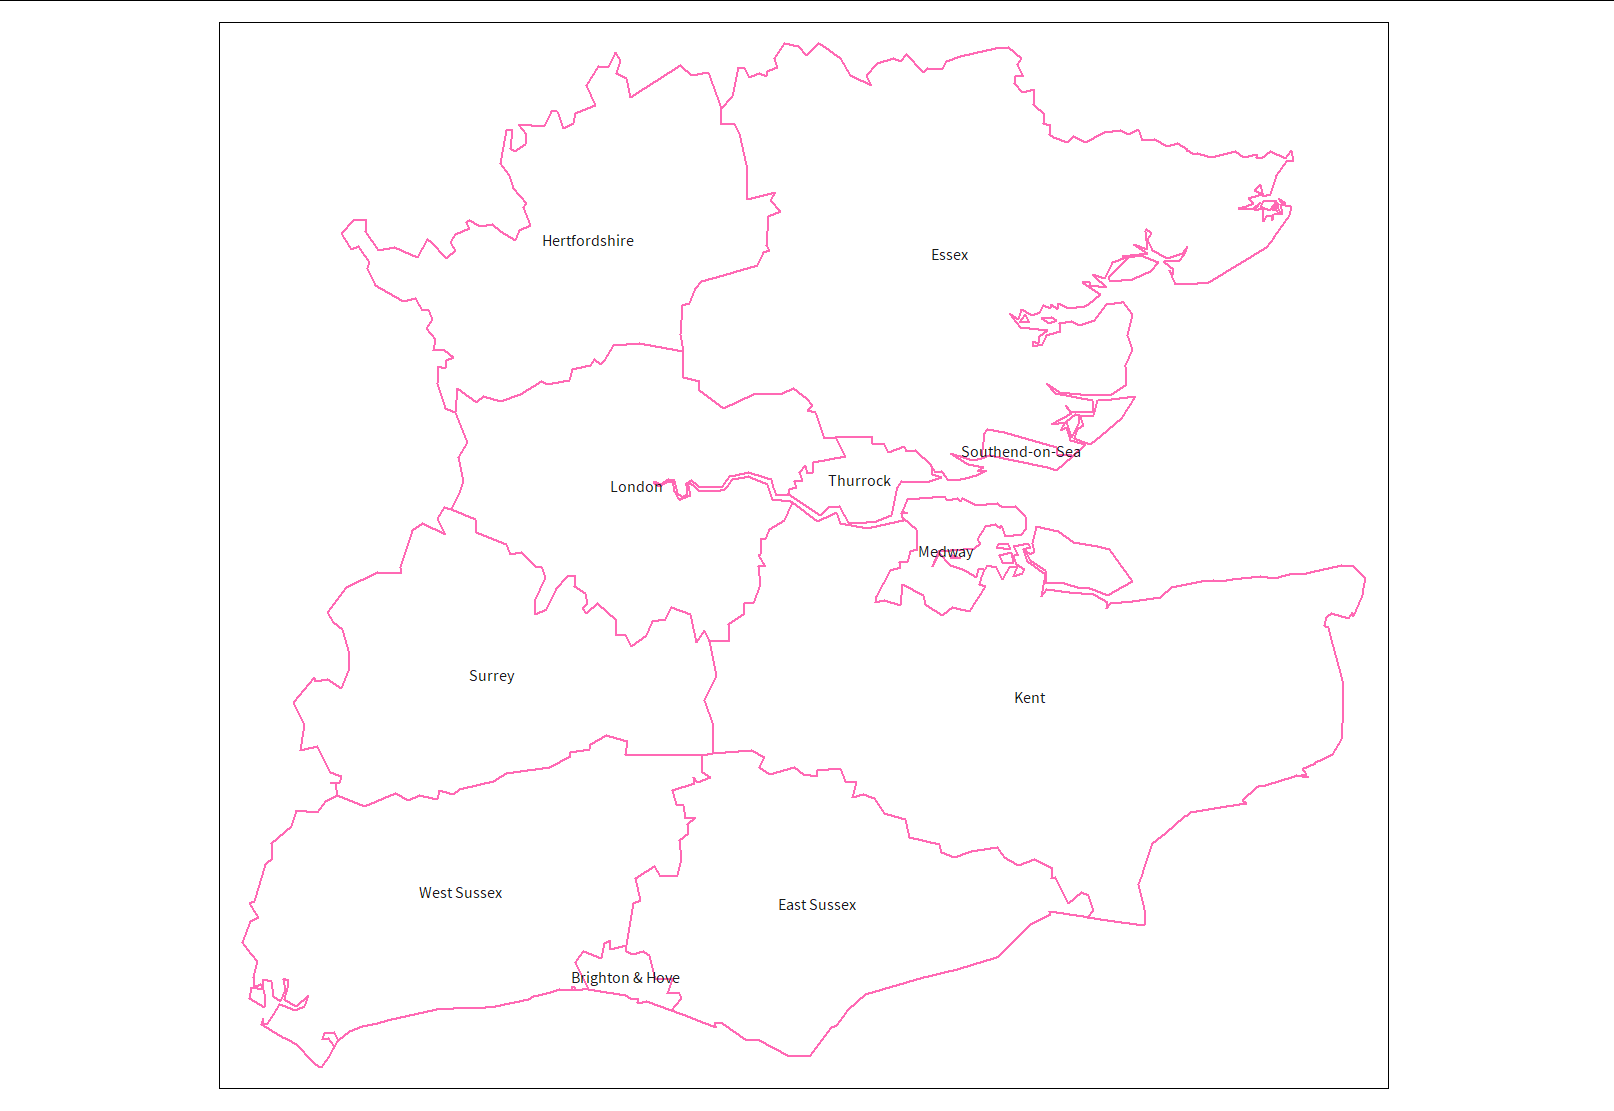
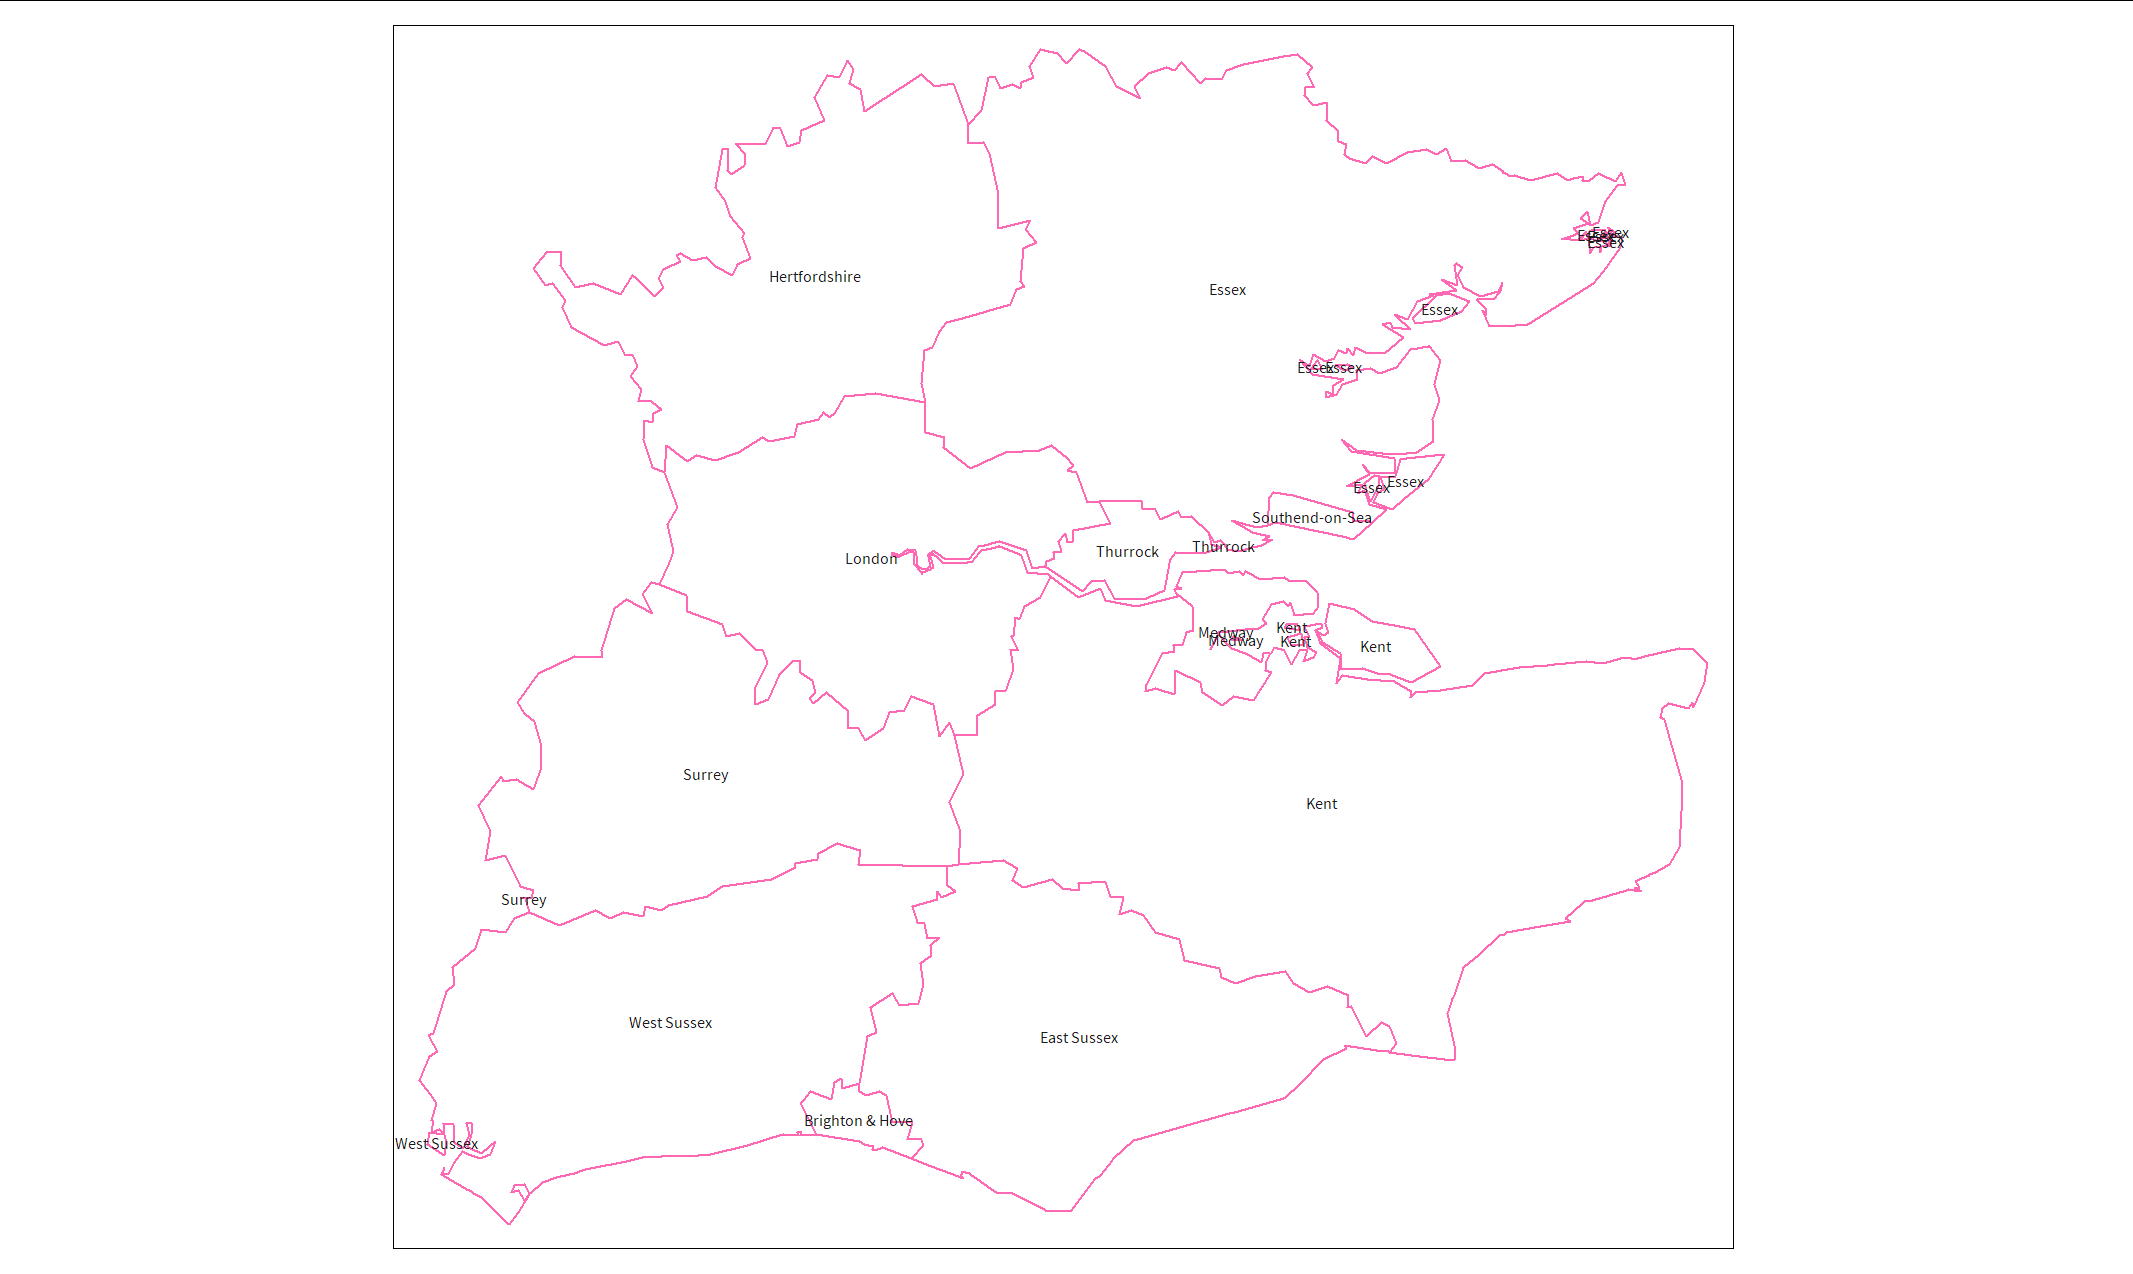
a) a set of unified areas ![]() , but with multiple text labels
, but with multiple text labels ![]() where the shape contains multiple polygons (eg islands) - see image below, noting the duplicated labels where there are islands at the coastline:
where the shape contains multiple polygons (eg islands) - see image below, noting the duplicated labels where there are islands at the coastline:
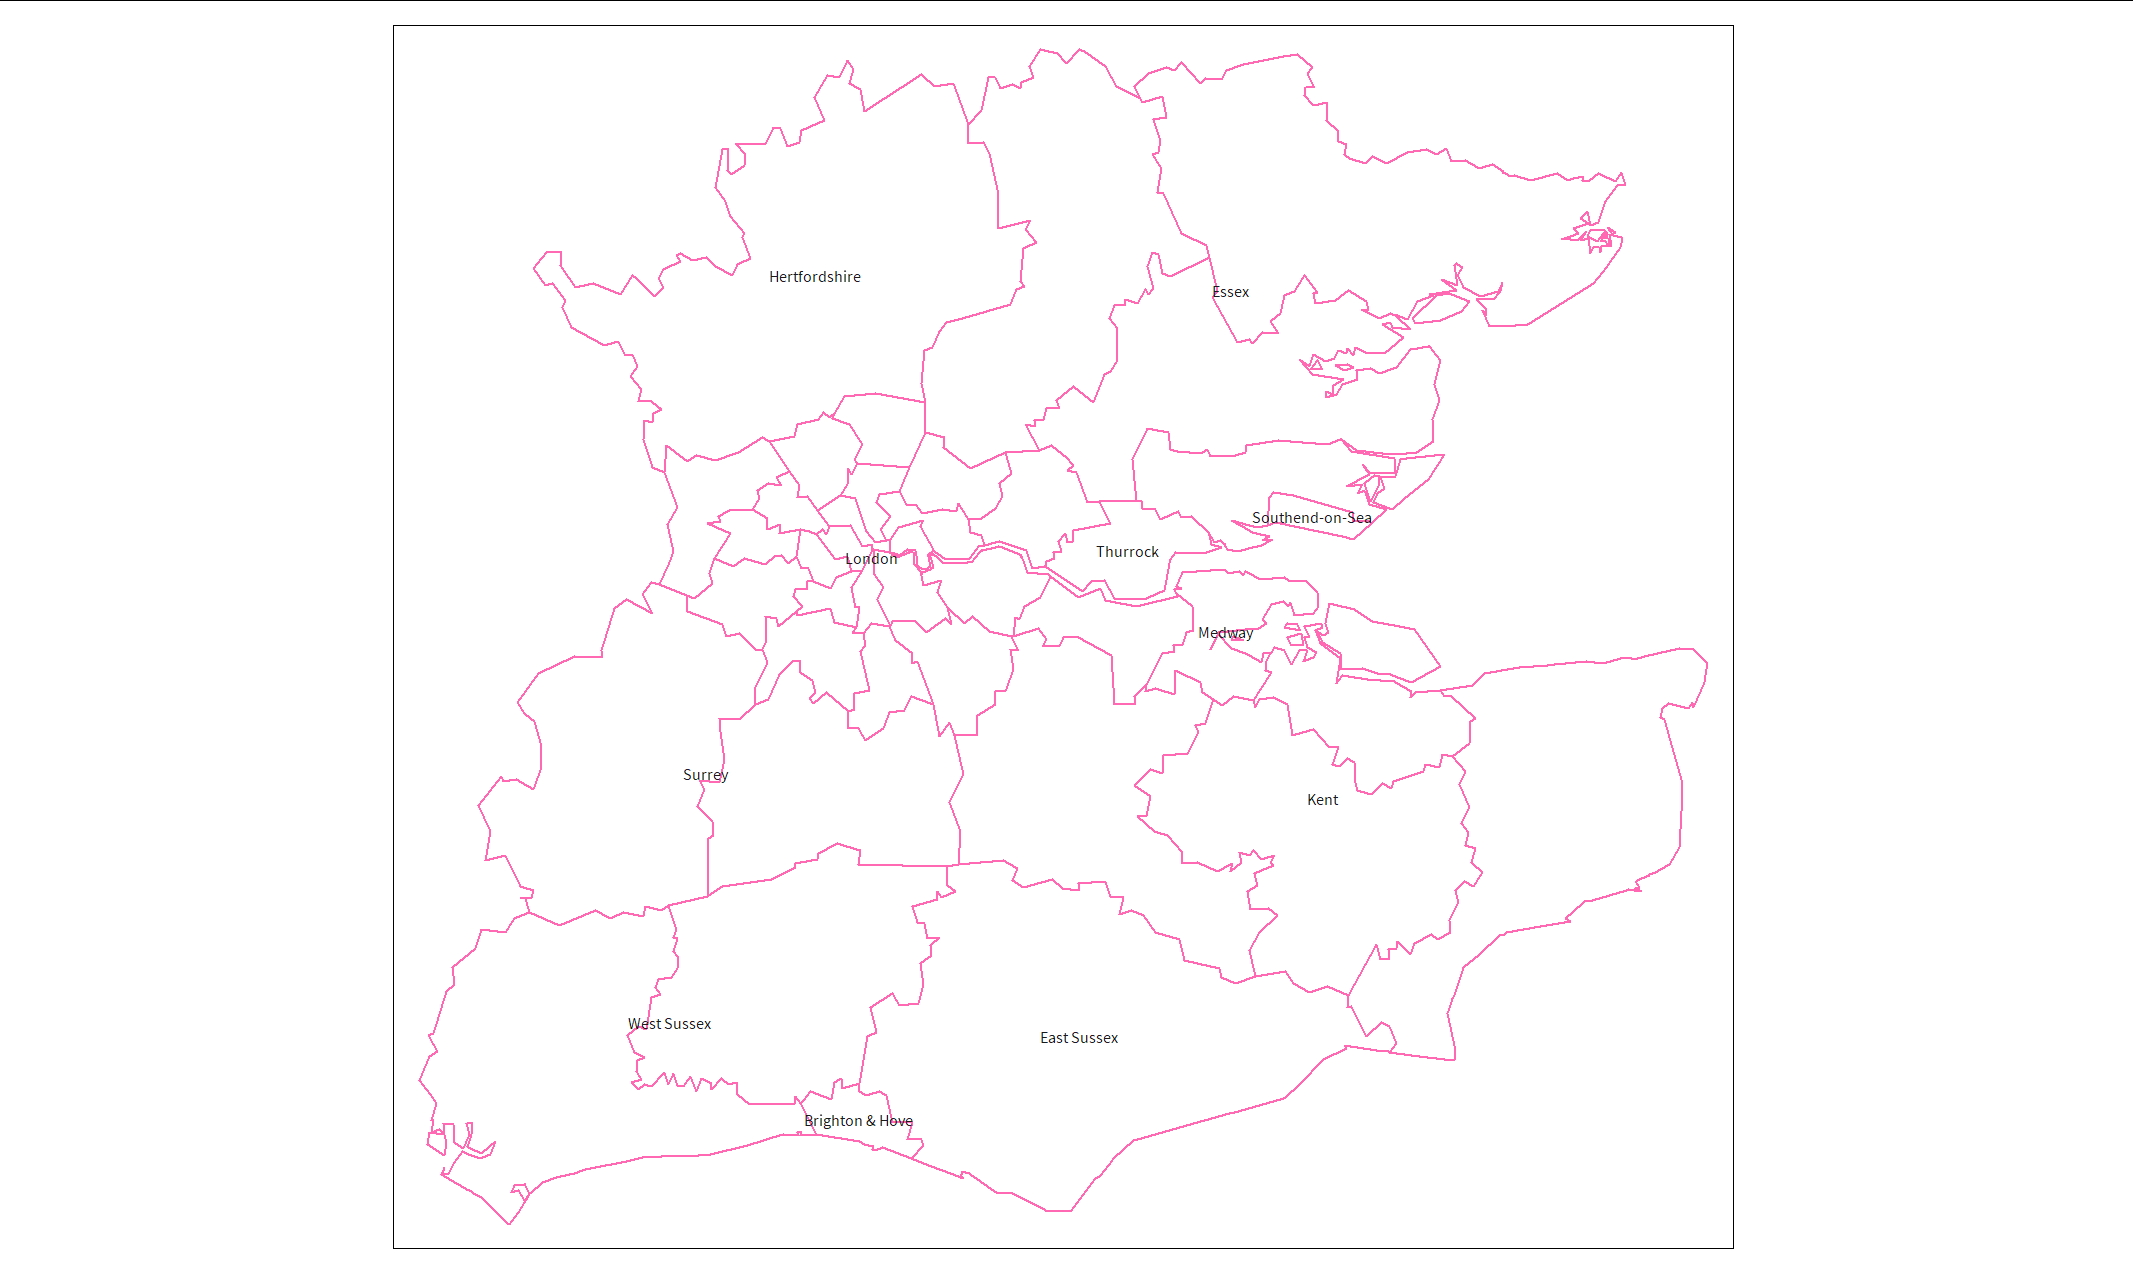
or b) a set of unduplicated labels ![]() but without successfully resolving the internal boundaries
but without successfully resolving the internal boundaries ![]()
a) comes from code like this:
sf_tibble %>%
  dplyr::group_by(area) %>%
  dplyr::summarise()
b) comes from:
sf_tibble %>%
  dplyr::group_by(area) %>%
  dplyr::summarise(across(geometry, ~ sf::st_combine(.)))
If I use st_combine followed by st_union:
sf_tibble %>%
  dplyr::summarise(across(geometry, ~ sf::st_combine(.)), .groups = "keep") %>%
  dplyr::summarise(across(geometry, ~ sf::st_union(.)), .groups = "drop")
I get the same result as b). It seems like the st_union makes no difference - it's no longer successfully unifying the smaller areas into the larger areas.
If I just use st_union:
sf_tibble %>%
  dplyr::summarise(across(geometry, ~ sf::st_union(.)), .groups = "drop")
I get the same result as a): unified areas but multiple labels.
Can I get what I want? What am I missing?