Hi all - This is my first post ever, so apologies for any missteps in this question. I am a statistical programmer in SAS, which is quite different from R and Shiny, and I am getting stuck on language and syntax. For this question, I have already googled around on this and other boards, and have tried many things. My gut tells me I'm missing something simple.
In my app, I want the user to select a variable (aka column, feature) from the dataset, and then have my scatter plot (aka geom_point) color the points according to that variable. These variables are all factor types and have different numbers of levels. Also, I want them each to use a different palette, which I set manually.
In the ggplot call, I try to refer to the name of the palette with a reactive (aka dynamic, macro) variable. But it is interpreted as a string of length 1, not as a reference to the palette vector I have already set up. (The equivalent in SAS would be a double ampersand (&&) reference to a macro variable within a macro.)
I have created a toy example and used reprex() to paste below.
Thank you so much,
Kate
library("shiny")
library("ggplot2")
library("tidyverse")
# Make a toy dataset
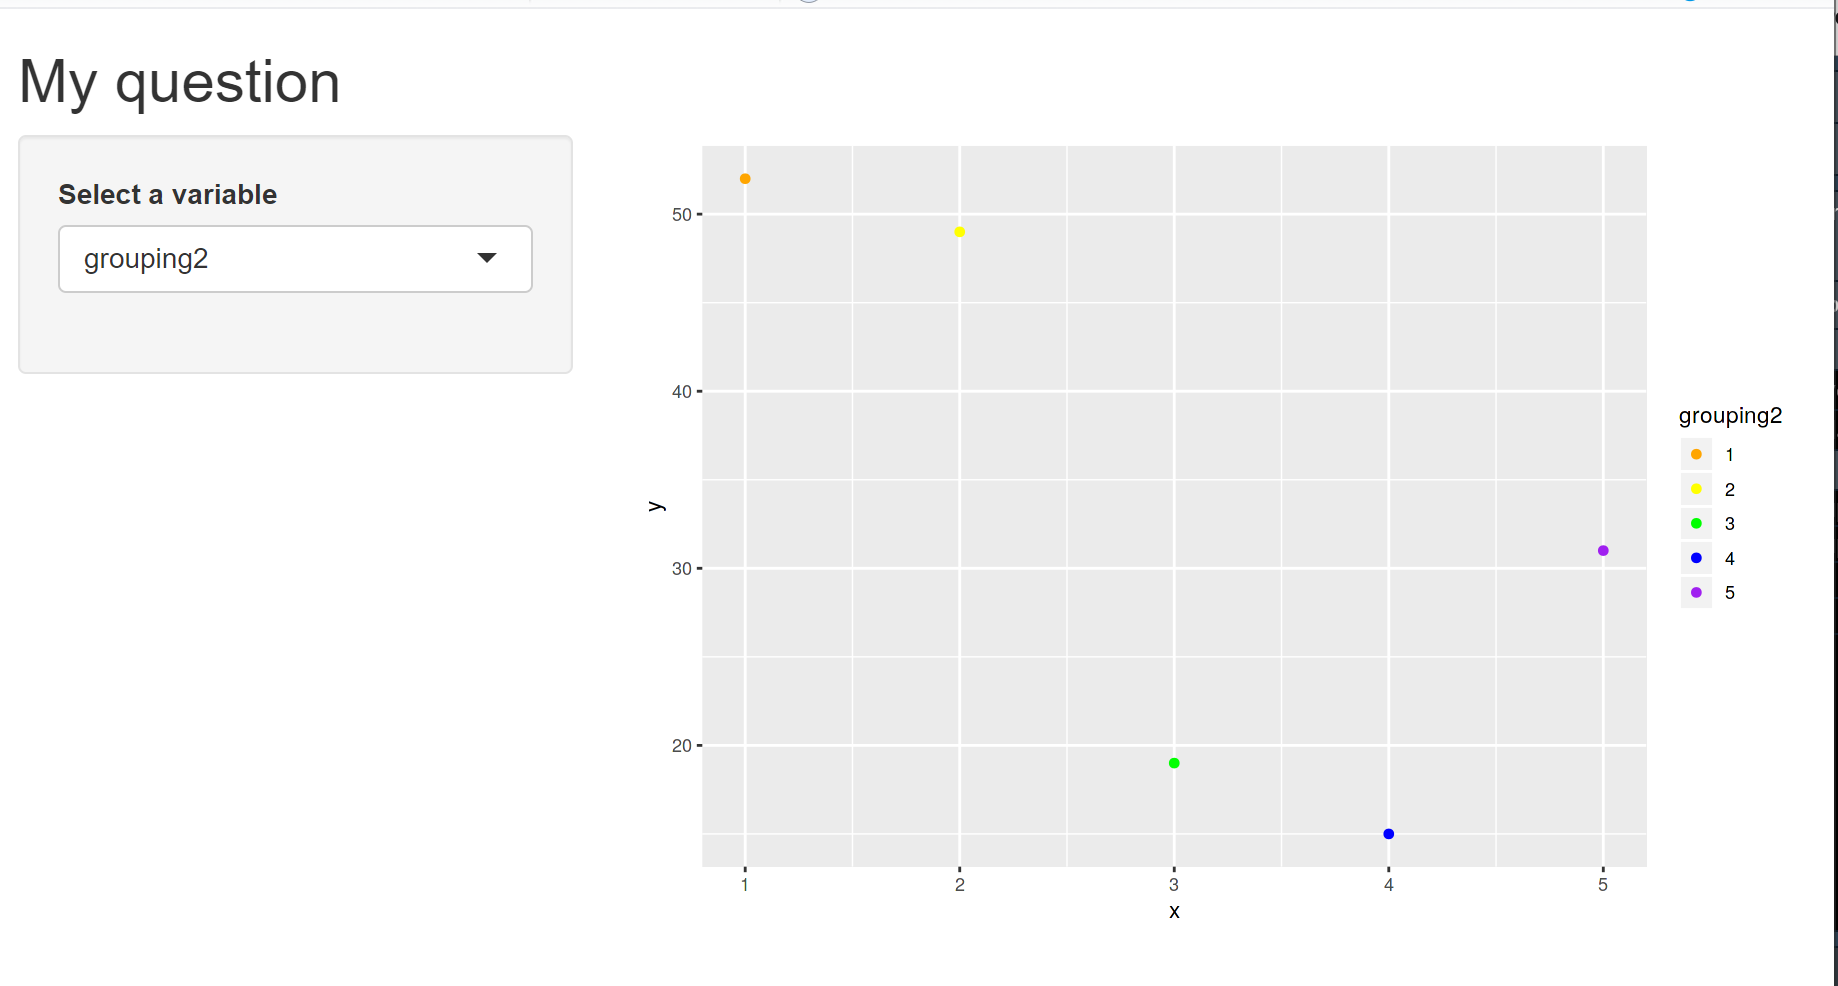
x <- c(1,2,3,4,5)
y <- c(52,49,19,15,31)
grouping1 <- as.factor(c(1,1,1,2,2))
grouping2 <- as.factor(c(1,2,3,4,5))
toydataset <- data.frame(x,y,grouping1,grouping2)
# Make palettes to apply to each grouping
palette1 <- c("blue","red")
palette2 <- c("orange","yellow","green","blue","purple")
# the UI bit:
ui <- fluidPage(
titlePanel("My question"),
sidebarLayout(
sidebarPanel(
selectInput(inputId = "selectedvariable",
label = "Select a variable",
choices = c("grouping1","grouping2")),
),
mainPanel(
plotOutput("myplot")
)
)
)
# the server bit:
server <- function(input, output) {
currentvariable <- reactive({input$selectedvariable})
currentpalette <- reactive({
if (input$selectedvariable == "grouping1"){palette1}
else if (input$selectedvariable == "grouping2"){palette2}
})
output$myplot <- renderPlot({
ggplot() +
geom_point(data = toydataset,
aes(x=x, y=y, color = currentvariable() )) +
scale_color_manual(values= (currentpalette() ))
})
}
# Run it
shinyApp(ui = ui, server = server)
Shiny applications not supported in static R Markdown documents
Created on 2019-12-08 by the reprex package (v0.3.0)