plotObj <- ggplot(prueba1, aes(x=V1, y=V2, group = 1)) + geom_line()
plotly::ggplotly(plotObj)
Thank you for your help!
plotObj <- ggplot(prueba1, aes(x=V1, y=V2, group = 1)) + geom_line()
plotly::ggplotly(plotObj)
Thank you for your help!
There are a few ways to do this in ggplot. For example, you can simply add layers to the plot. If the data are in different data frames, you can designate the data frame in the geoms. How are your data stored?
DF1 <- data.frame(X=1:4,Y=3:6)
DF2 <- data.frame(X2=11:14,Y2=c(13,15,17,18))
library(ggplot2)
ggplot() + geom_line(aes(x = X, y = Y), data = DF1) +
  geom_line(aes(x = X2, y = Y2), data = DF2, color = "red")
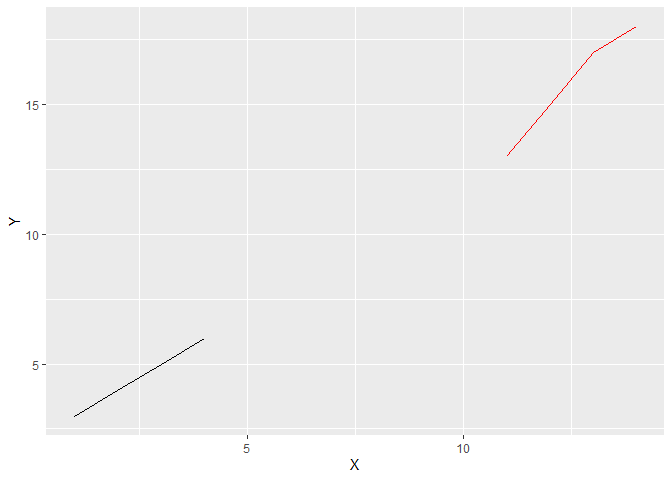
Created on 2023-02-02 with reprex v2.0.2
Thank you for your help!
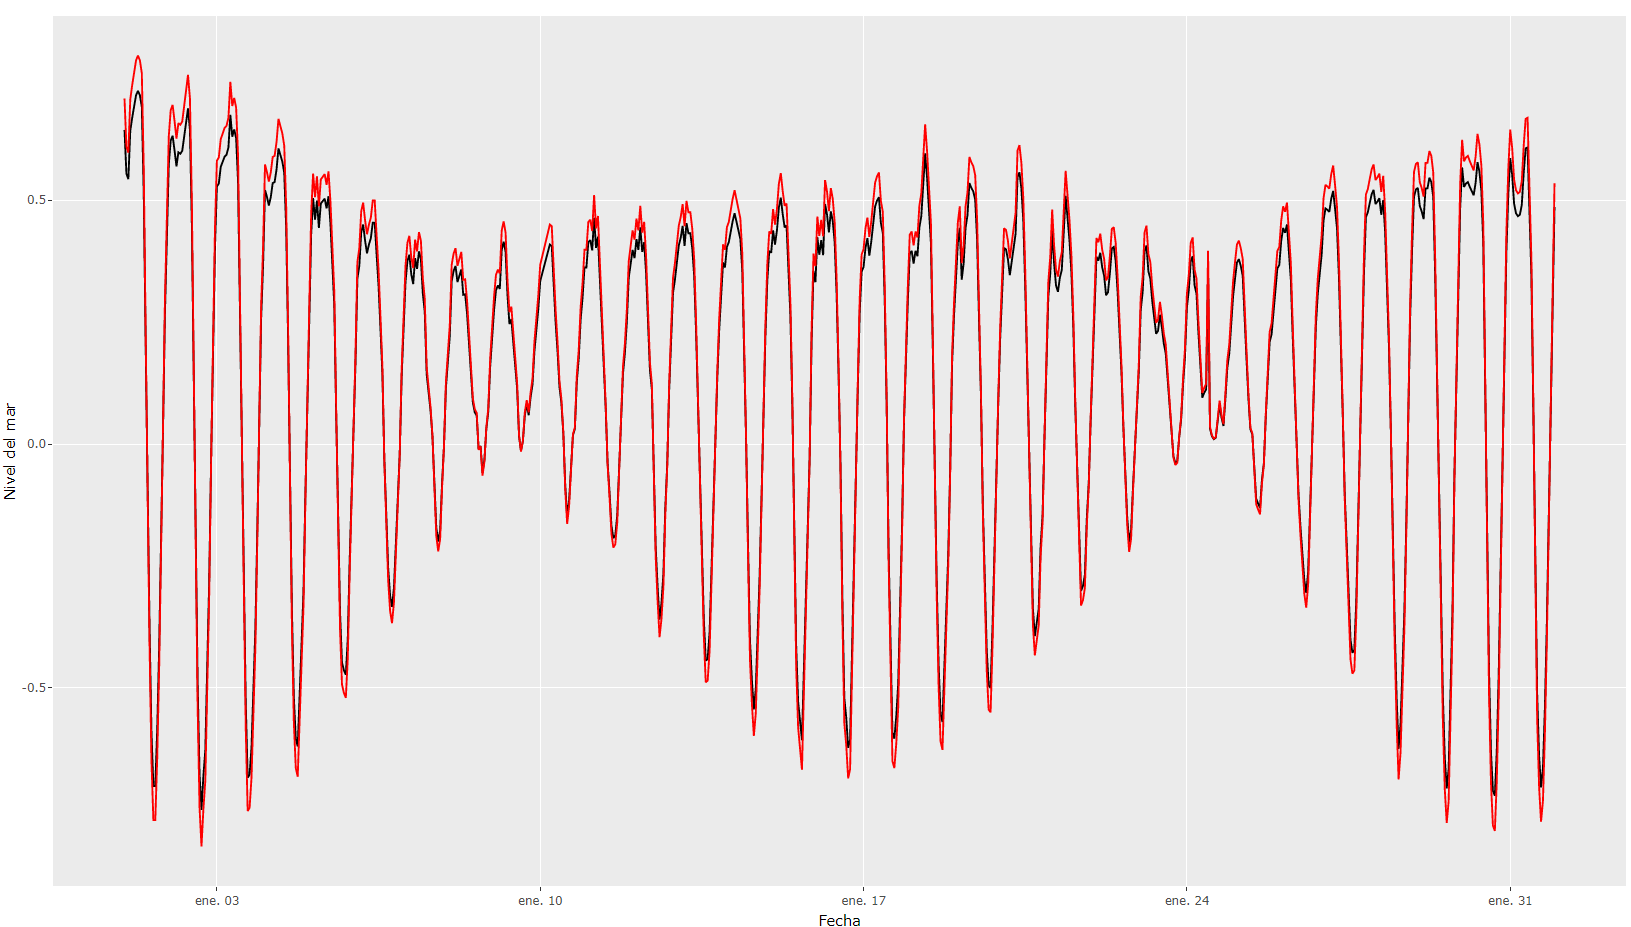
My data is a time series in txt that I import from (import data set) which contains 3 columns (time, var1, var2) which I call test1.
Another question arose, how can I give it more ticks or breaks on my x-axis (it automatically sets it to every 7 days)
Thank
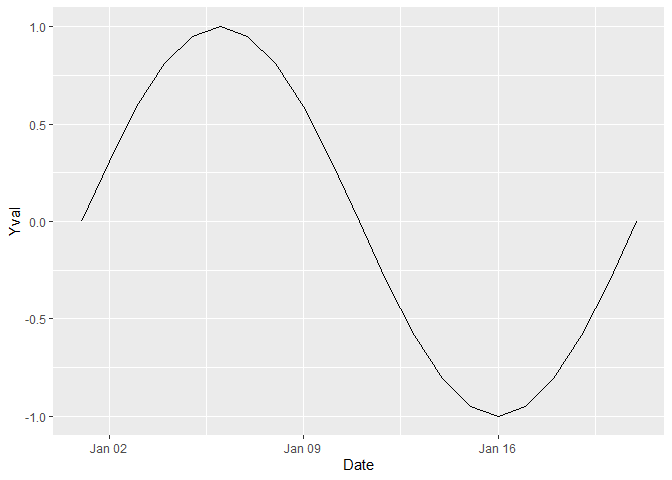
You can use the scale_x_date() function to adjust your x axis.
library(ggplot2)
DF <- data.frame(Date = seq.Date(from = as.Date("2023-01-01"),
                                 to = as.Date("2023-01-21"), by = 1),
                 Yval = sin(seq(0,2*pi,length.out = 21)))

ggplot(DF, aes(Date, Yval)) + geom_line()
ggplot(DF, aes(Date, Yval)) + geom_line() +
  scale_x_date(date_breaks = "2 days", date_labels = "%b %d")
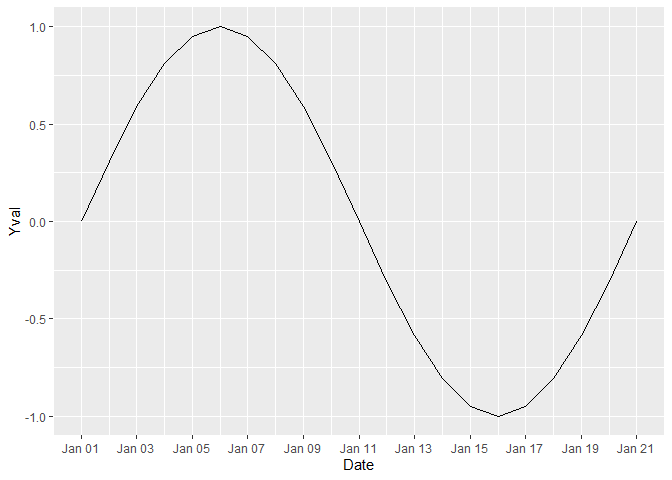
Created on 2023-02-02 with reprex v2.0.2
I try but it gives me an error that says the following:
"Error: Invalid input: date_trans works with objects of class Date only"
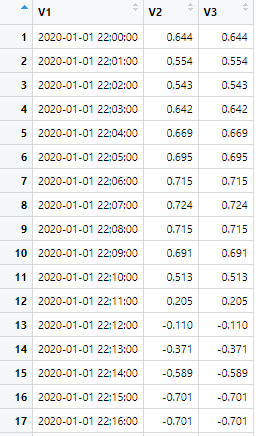
I converted my character time column to date with the following function "test1$V1 <- dmy_hms(test1$V1)" and later I use "class(test1$V1)" and I get the following: [1] "POSIXct" "POSIXt" .
I think it's because it's not recognizing my time column as date.
I attach an image of my data.
I misunderstood that you are working with dates. There is also a function named scale_x_datetime() that should work for you.
library(ggplot2)
DF <- data.frame(Date = seq.POSIXt(from = as.POSIXct("2023-01-01 00:00:00"),
                                 to = as.POSIXct("2023-01-21 00:00:00"),
                                 by = "1 hour"),
                 Yval = sin(seq(0,2*pi,length.out = 481)))

ggplot(DF, aes(Date, Yval)) + geom_line() +
  scale_x_datetime(date_breaks = "2 days", date_labels = "%b %d")
It worked!! Perfect, thank you very much ![]()
![]()
This topic was automatically closed 7 days after the last reply. New replies are no longer allowed.
If you have a query related to it or one of the replies, start a new topic and refer back with a link.