Dear @technocrat,
I am not sure if there is a possibility to use together plot, and ggplot2. So I decided to use plotrix, and dcr packages mainly because within the ggplot2 environment, it was "impossible" to fit a four parametric logistic function.
Answering the second question, the data.frame is the second part of my data (please see attached)
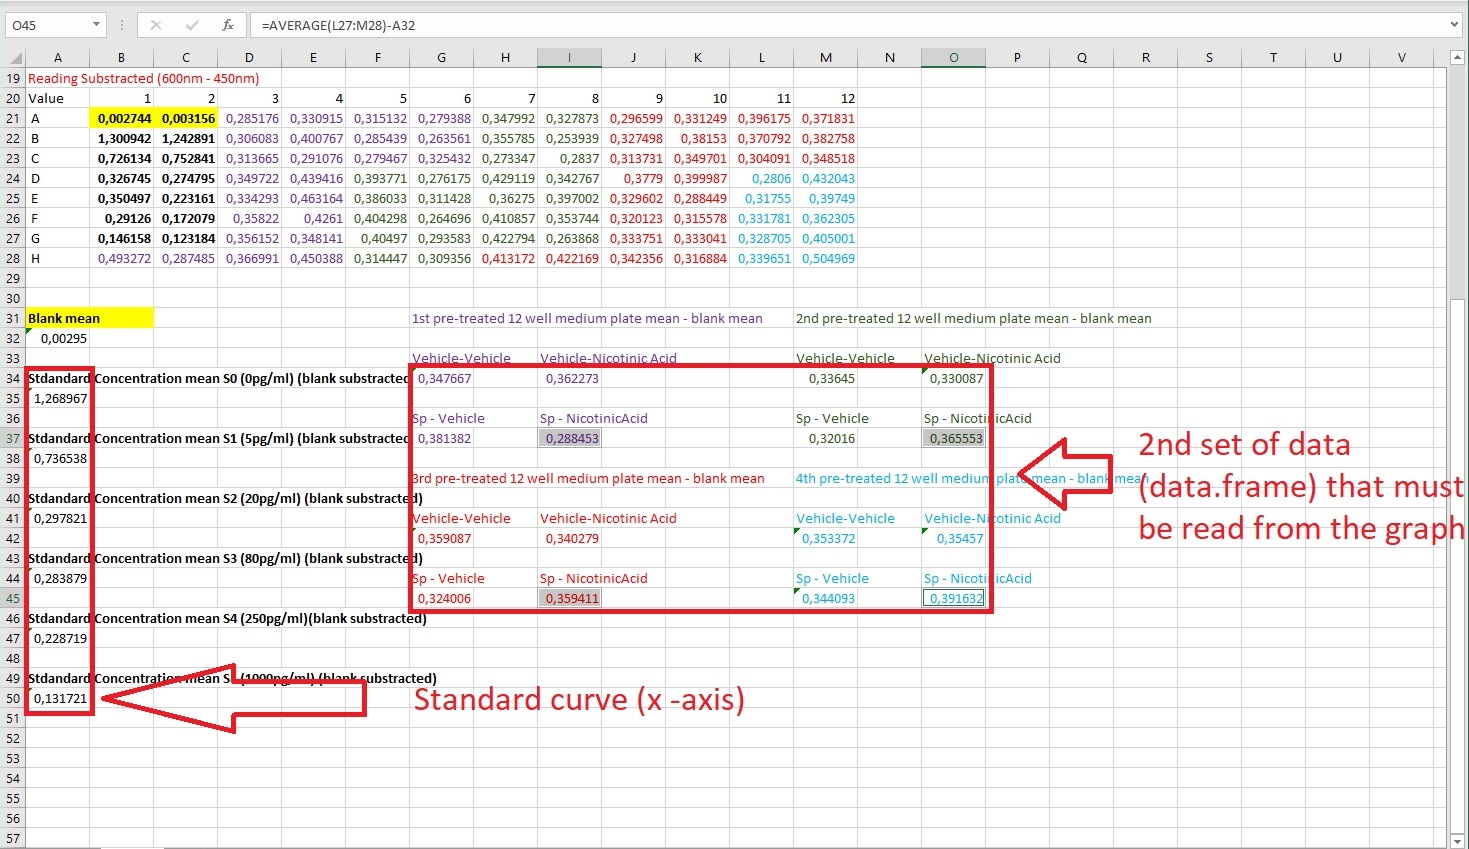
I know that I must have made a mistake, and I divided these data instead of keeping them as one set of data, not two as in this example. So, the relationship between the first and second set of data is, that the first set of data was used to produce the standard curve with a four parametric logistic function. The second part of the data should be used to read the absorbance from the y-axis.
Thank you