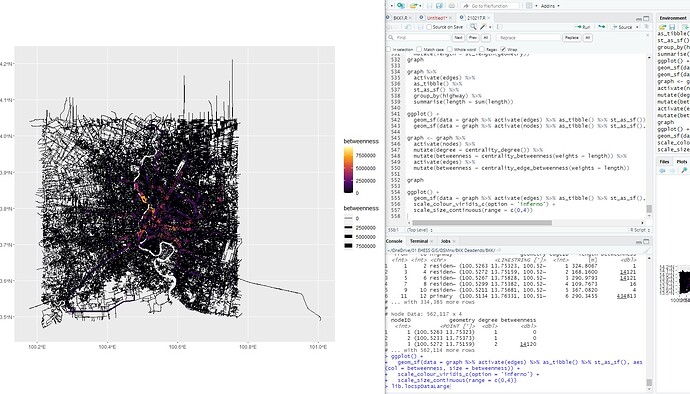
Hello, I have worked with centrality calculation from OSM database. I followed the instruction Spatial networks in R with sf and tidygraph .
However, I want to export the shapefile of the street network that carries centralities values. I am new to R. So I am not sure what part is used as an object to export.
I tried 2 method
- writeOGR
writeOGR("edges", dsn="210217", layer="edges", driver = "ESRI Shapefile")
then it always show
SRI Shapefile") : inherits(obj, "Spatial") is not TRUE
- st_write
st_write(graph, "bkk.shp")
sf::st_write(graph, "bkk.shp", driver = "ESRI Shapefile")
Error in UseMethod("st_write") :
no applicable method for 'st_write' applied to an object of class "c('tbl_graph', 'igraph')"
-------------------------------- code I would start from this part ----
writeVECT(
SDF = bangkok_center,
vname = 'bangkok_center',
v.in.ogr_flags = 'overwrite'
)
execGRASS("g.proj", flags = c("c", "quiet"), proj4 = proj4)
execGRASS(
cmd = 'v.clean',
input = 'bangkok_center',
output = 'bangkok_cleaned',
tool = 'break',
flags = c('overwrite', 'c')
)
edges <-bangkok_center %>%
mutate(edgeID = c(1:n()))
edges
nodes <- edges %>%
st_coordinates() %>%
as_tibble() %>%
rename(edgeID = L1) %>%
group_by(edgeID) %>%
slice(c(1, n())) %>%
ungroup() %>%
mutate(start_end = rep(c('start', 'end'), times = n()/2))
nodes
nodes <- nodes %>%
mutate(xy = paste(.$X, .$Y)) %>%
mutate(nodeID = group_indices(., factor(xy, levels = unique(xy)))) %>%
select(-xy)
nodes
source_nodes <- nodes %>%
filter(start_end == 'start') %>%
pull(nodeID)
target_nodes <- nodes %>%
filter(start_end == 'end') %>%
pull(nodeID)
edges = edges %>%
mutate(from = source_nodes, to = target_nodes)
edges
nodes <- nodes %>%
distinct(nodeID, .keep_all = TRUE) %>%
select(-c(edgeID, start_end)) %>%
st_as_sf(coords = c('X', 'Y')) %>%
st_set_crs(st_crs(edges))
nodes
graph = tbl_graph(nodes = nodes, edges = as_tibble(edges), directed = FALSE)
graph
sf_to_tidygraph = function(x, directed = TRUE) {
edges <- x %>%
mutate(edgeID = c(1:n()))
nodes <- edges %>%
st_coordinates() %>%
as_tibble() %>%
rename(edgeID = L1) %>%
group_by(edgeID) %>%
slice(c(1, n())) %>%
ungroup() %>%
mutate(start_end = rep(c('start', 'end'), times = n()/2)) %>%
mutate(xy = paste(.$X, .$Y)) %>%
mutate(nodeID = group_indices(., factor(xy, levels = unique(xy)))) %>%
select(-xy)
source_nodes <- nodes %>%
filter(start_end == 'start') %>%
pull(nodeID)
target_nodes <- nodes %>%
filter(start_end == 'end') %>%
pull(nodeID)
edges = edges %>%
mutate(from = source_nodes, to = target_nodes)
nodes <- nodes %>%
distinct(nodeID, .keep_all = TRUE) %>%
select(-c(edgeID, start_end)) %>%
st_as_sf(coords = c('X', 'Y')) %>%
st_set_crs(st_crs(edges))
tbl_graph(nodes = nodes, edges = as_tibble(edges), directed = directed)
}
sf_to_tidygraph(bangkok_center, directed = FALSE)
graph <- graph %>%
activate(edges) %>%
mutate(length = st_length(geometry))
graph
graph %>%
activate(edges) %>%
as_tibble() %>%
st_as_sf() %>%
group_by(highway) %>%
summarise(length = sum(length))
ggplot() +
geom_sf(data = graph %>% activate(edges) %>% as_tibble() %>% st_as_sf()) +
geom_sf(data = graph %>% activate(nodes) %>% as_tibble() %>% st_as_sf(), size = 0.5)
graph <- graph %>%
activate(nodes) %>%
mutate(degree = centrality_degree()) %>%
mutate(betweenness = centrality_betweenness(weights = length)) %>%
activate(edges) %>%
mutate(betweenness = centrality_edge_betweenness(weights = length))
graph
st_write(graph, "bkk.shp")
sf::st_write(graph, "bkk.shp", driver = "ESRI Shapefile")
ggplot() +
geom_sf(data = graph %>% activate(edges) %>% as_tibble() %>% st_as_sf(), aes(col = betweenness, size = betweenness)) +
scale_colour_viridis_c(option = 'inferno') +
scale_size_continuous(range = c(0,4))
ggplot() +
geom_sf(data = graph %>% activate(edges) %>% as_tibble() %>% st_as_sf(), col = 'grey50') +
geom_sf(data = graph %>% activate(nodes) %>% as_tibble() %>% st_as_sf(), aes(col = degree, size = degree)) +
scale_colour_viridis_c(option = 'inferno') +
scale_size_continuous(range = c(0,4))
Thank you very much.


