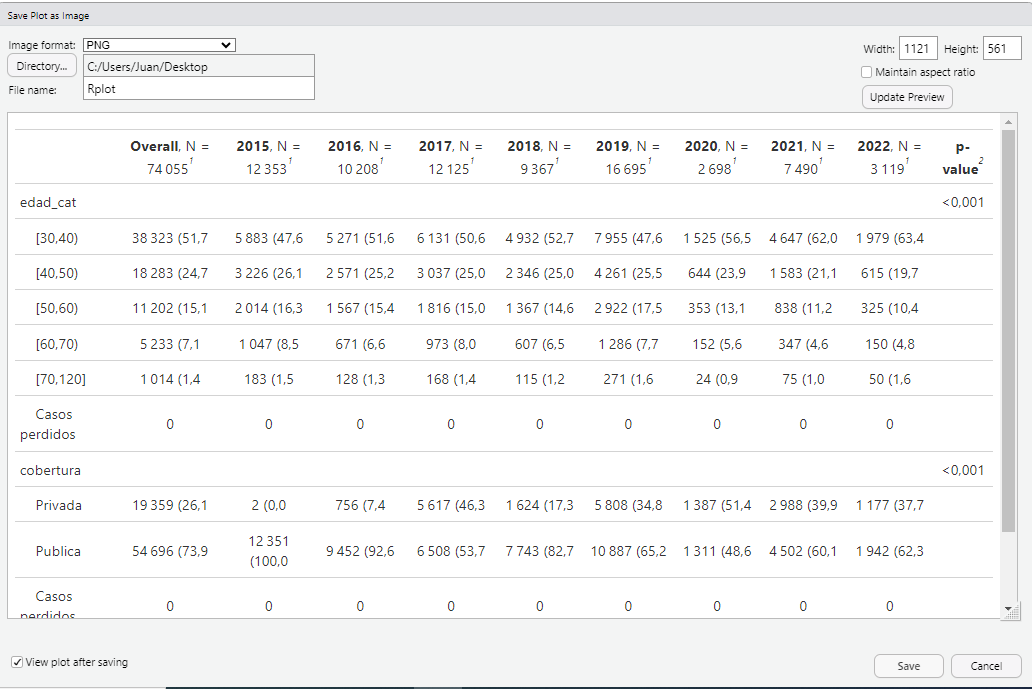
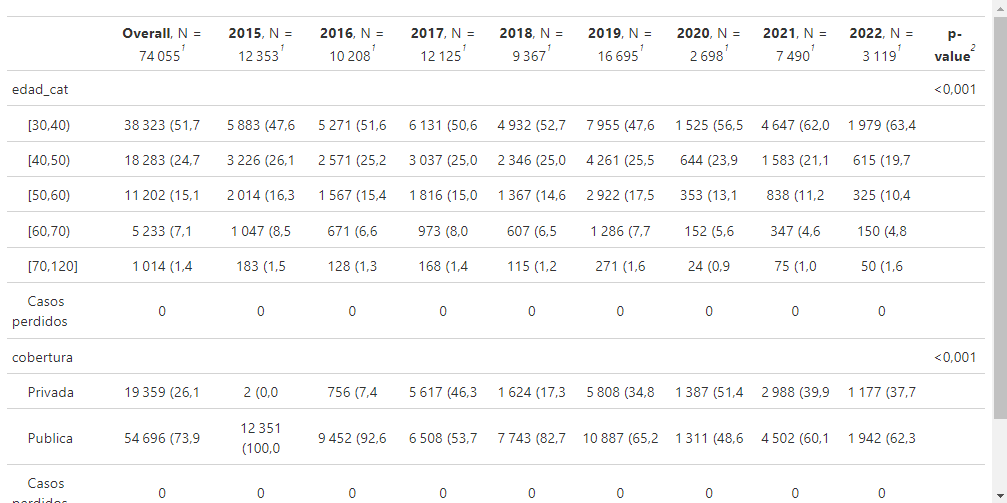
I would like to save in a chart the tables I make with the gtsummary package to avoid having to pass the data to an excel, the problem is that when the chart is too big I can't export it completely. I attach images as a proof.
Since you mention Excel, I'm guessing that's your desired destination. Take a look at the function as_hux_xlsx(): Convert gtsummary object to a huxtable object — as_hux_table • gtsummary
out_gts <- tbl_summary() %>% .. # whatever your code to make gtsummary table

as_hux_xlsx(out_gts, file="mytable.xlsx")
A reprex for your consideration:
library(gtsummary)
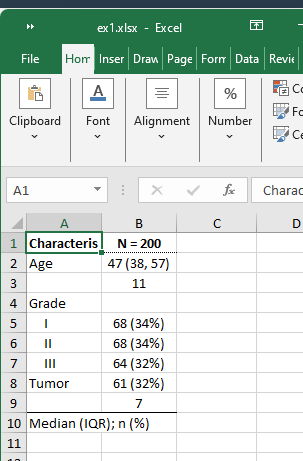
tbl_summary_ex1 <-
trial %>%
select(age, grade, response) %>%
tbl_summary()
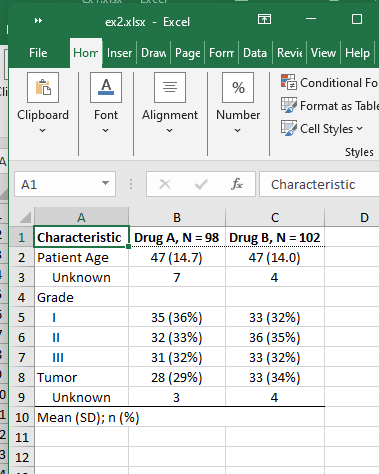
tbl_summary_ex2 <-
trial %>%
select(age, grade, response, trt) %>%
tbl_summary(
by = trt,
label = list(age ~ "Patient Age"),
statistic = list(all_continuous() ~ "{mean} ({sd})"),
digits = list(age ~ c(0, 1))
)
as_hux_xlsx(tbl_summary_ex1, "ex1.xlsx")
as_hux_xlsx(tbl_summary_ex2, "ex2.xlsx")
Created on 2024-04-08 with reprex v2.0.2
Here is a snippet of the image you posted;
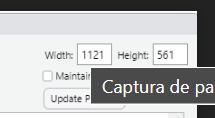
it shows theres pixel width and height control available to you.
make these large enough for the content to fit within without the scroll bars , and you'll have the image you want.
Hello, thank you for your reply.
I did not know as_hux_xlsx() function, I will look into it.
No, excel is not my default destination, I am also interested in having those tables in image format so I can paste it in word or power point files.
Hi, doesn't work like that. I shrink the image but the data disappears, it does not follow the frame.
You shrink the image ? I thought you would enlarge the image, to encompass the table...
Can you provide a reproducible example ?
Hello, yes sorry it was a translation error on my part, I thought you were telling me that shrinking the image could fit the whole picture.
I tried enlarging the image as you say but I have reached the limit of what is available (I put a larger number and it automatically resets to the maximum number). And still the whole frame does not fit in the image.
This topic was automatically closed 42 days after the last reply. New replies are no longer allowed.
If you have a query related to it or one of the replies, start a new topic and refer back with a link.