How can I explicitly (rather than positionally) control labels and color mappings in ggplot?
I can control labels and fill colors with positional arguments like so
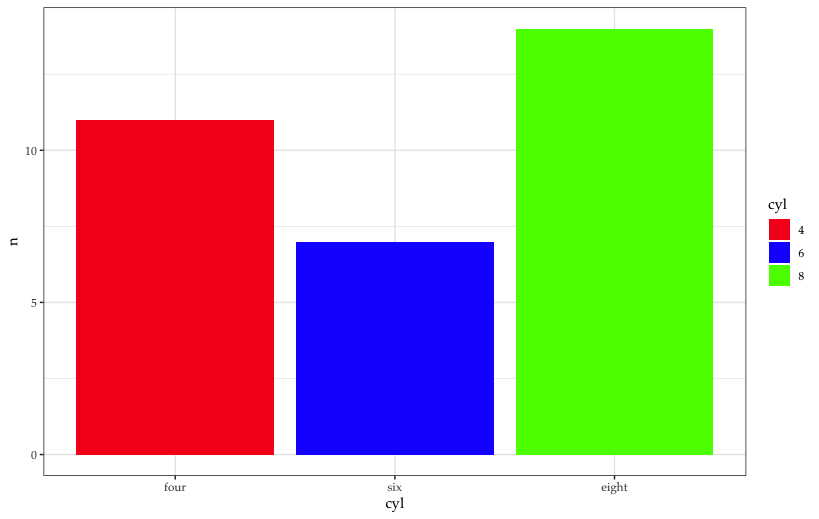
mtcars %>%
	count(cyl) %>%
	mutate(cyl = as.factor(cyl)) %>%
	ggplot(aes(x = cyl, y = n, fill = cyl)) +
	geom_col() +
	scale_x_discrete(labels = c('four', 'six', 'eight')) +
	scale_fill_manual(values = c('red', 'blue', 'green'))
But I want more explicit mappings like this for scenarios where there is a risk of mislabeling/miscoloring. I think this can be done within ggplot.
mtcars %>%
	count(cyl) %>%
	mutate(cyl = as.factor(cyl)) %>%
	ggplot(aes(x = cyl, y = n, fill = cyl)) +
	geom_col() +
	scale_x_discrete(labels = c(4 = 'four', 6 = 'six', 8 = 'eight')) +
	scale_fill_manual(values = c(4 = 'red', 6 = 'blue', 8 = 'green'))