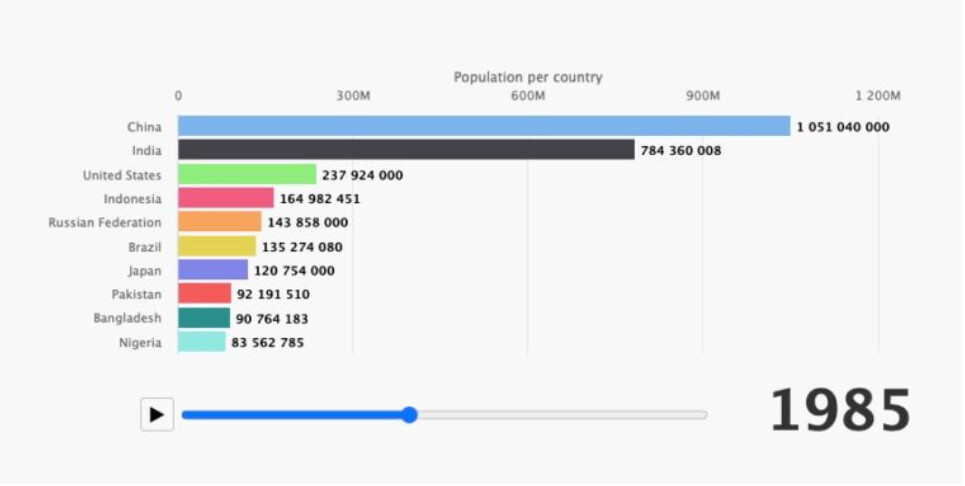
How to draw a race bar chart using higcharter or ramcharts on gapminder data simillar to this chart
library(tidyverse)
library(gapminder)
dataset <- gapminder::gapminder %>%
  dplyr::filter(continent == "Asia") %>%
  dplyr::group_by(country) %>%
  tidyr::complete(year = full_seq(year, 1)) %>%
  mutate(pop = spline(x = year, y = pop, xout = year)$y) %>%
  group_by(year) %>%
  mutate(rank = min_rank(-pop) * 1) %>%
  ungroup()