Hi.. i am wondering how to draw this chart in ggplot2 with ggalt::geom_xspline
Possibly like this if I understand the question:
suppressMessages(library(data.table));
suppressMessages(library(tidyverse))
library(ggalt)
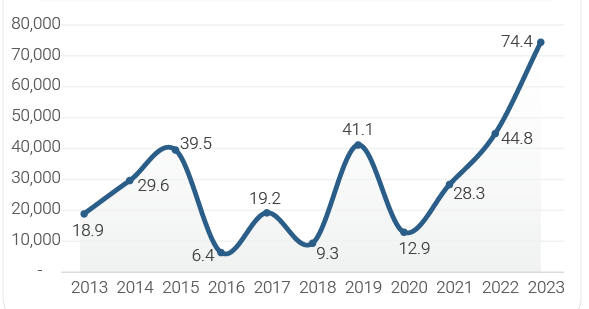
DT <- data.table( xx = seq(2013, 2023, by = 1),
yy = c(18.9, 29.6, 39.5, 6.4, 19.2, 9.3, 41.1, 12.9, 28.3, 44.8, 74.1))
ggplot(DT, aes(xx, yy)) + geom_point() + geom_xspline()
ggplot(DT, aes(xx, yy)) +
  geom_point() +
  scale_x_continuous(breaks = seq(2013, 2023, by = 1)) +
  geom_xspline(color = "#0003f3", linewidth = 20)
I have used the breaks in scale_x_continuous in order to get proper x asix.
there are two problems
- geom_xspline does not accept linewidth and if i change to size argument, it is not working
- how to shade the area under the line
I am wondering if there a way to function i could pass xx and and yy and it will calculate the spline.
Here is a start on a handcrafted ggplot version.
suppressMessages(library(data.table));
suppressMessages(library(tidyverse))
DT <-  data.table( xx = seq(2013, 2023, by = 1),
                   yy = c(18.9, 29.6, 39.5, 6.4, 19.2, 9.3, 41.1, 12.9, 28.3, 44.8, 74.1))
Pts <- as.data.frame(spline(x = DT$yy, n = 110))

ggplot(DT, aes(xx, yy)) +  geom_point() +
  geom_line(aes(x = x + 2012, y = y), data = Pts, linewidth = 1) +
  geom_area(aes(x = x + 2012, y = y), data = Pts, color = "steelblue", alpha = 0.3) +
  geom_text(aes(x = xx + 0.2, y = yy + 2, label = yy)) +
  scale_x_continuous(breaks = 2013:2023)

Created on 2024-02-24 with reprex v2.0.2
This topic was automatically closed 7 days after the last reply. New replies are no longer allowed.
If you have a query related to it or one of the replies, start a new topic and refer back with a link.