I have a matrix of values, determined from several experiments of combining drugs in diseased cells. Results look like a 10 x 10 matrix of drug interaction scores. My goal is to use permutation testing to determine whether a given square o the matrix is statistically significant. Simplified my question is:
How can I use permutations to obtain p-values for every square in my matrix?
A dummy 10 x 10 matrix, where one value is clearly different than other given values of the matrix :
library(ggplot2)
library(reshape2)
my_mat <- matrix(1:10, nrow=10, ncol=10)
my_mat[5,5] <- 80 #Make one cell clearly different than the rest
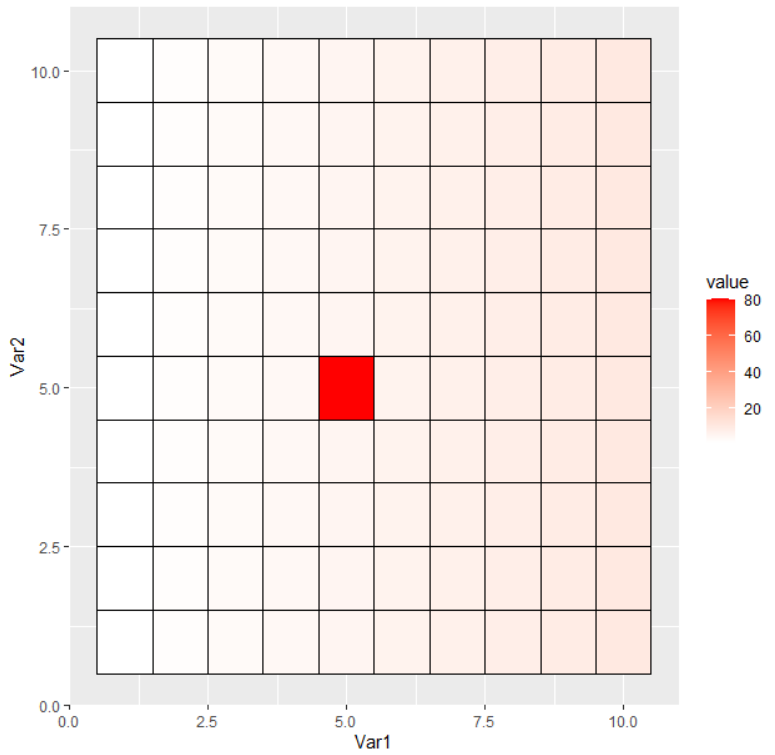
ggplot(melt(my_mat), aes(x=Var1, y=Var2, fill=value)) + geom_tile(color="black", size=0.6) + scale_fill_gradient(low="white", high="red")
The result looks like this:
How can I permute this matrix and obtain p-values?