I don't know what exactly the problem is, but this works
```{r, setup}
library(reticulate)
use_python("/usr/bin/python3")
matplotlib <- import("matplotlib")
matplotlib$use("Agg", force = TRUE)
```

```{python, engine.path = '/usr/bin/python3'}
import pandas as pd
import matplotlib.pyplot as plt
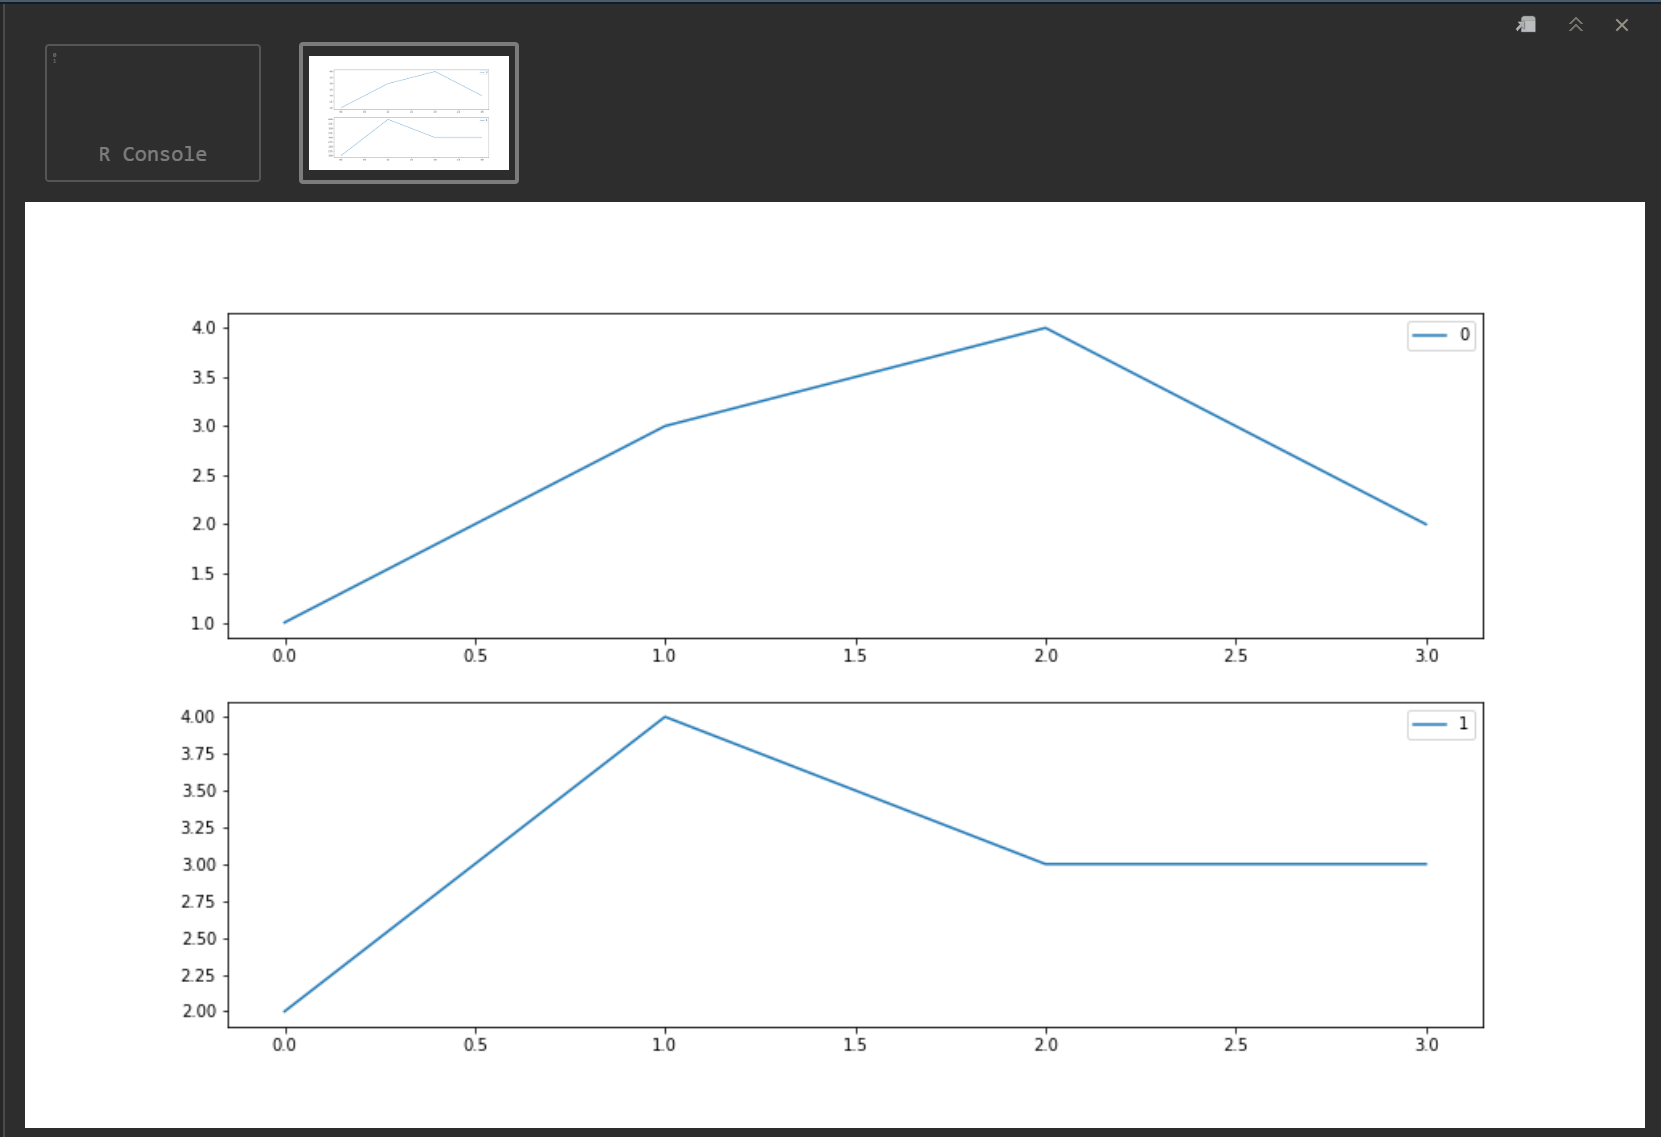
df=pd.DataFrame([[1, 2], [3, 4], [4, 3], [2, 3]])
fig = plt.figure(figsize=(14,8))
for i in df.columns:
    ax=plt.subplot(2,1,i+1)
    df[[i]].plot(ax=ax)
    print(i)

plt.show()
```
Obviously you have to set your own python engine path depending in your python version and operating system.