In a rmarkdown document, I use python chunk to display the plot by python code. The python code works but no figure displays, even I knit a html document.
Here is my r code
library(reticulate)
use_condaenv("base")
Here is my python code
import pandas as pd
import matplotlib.pyplot as plt
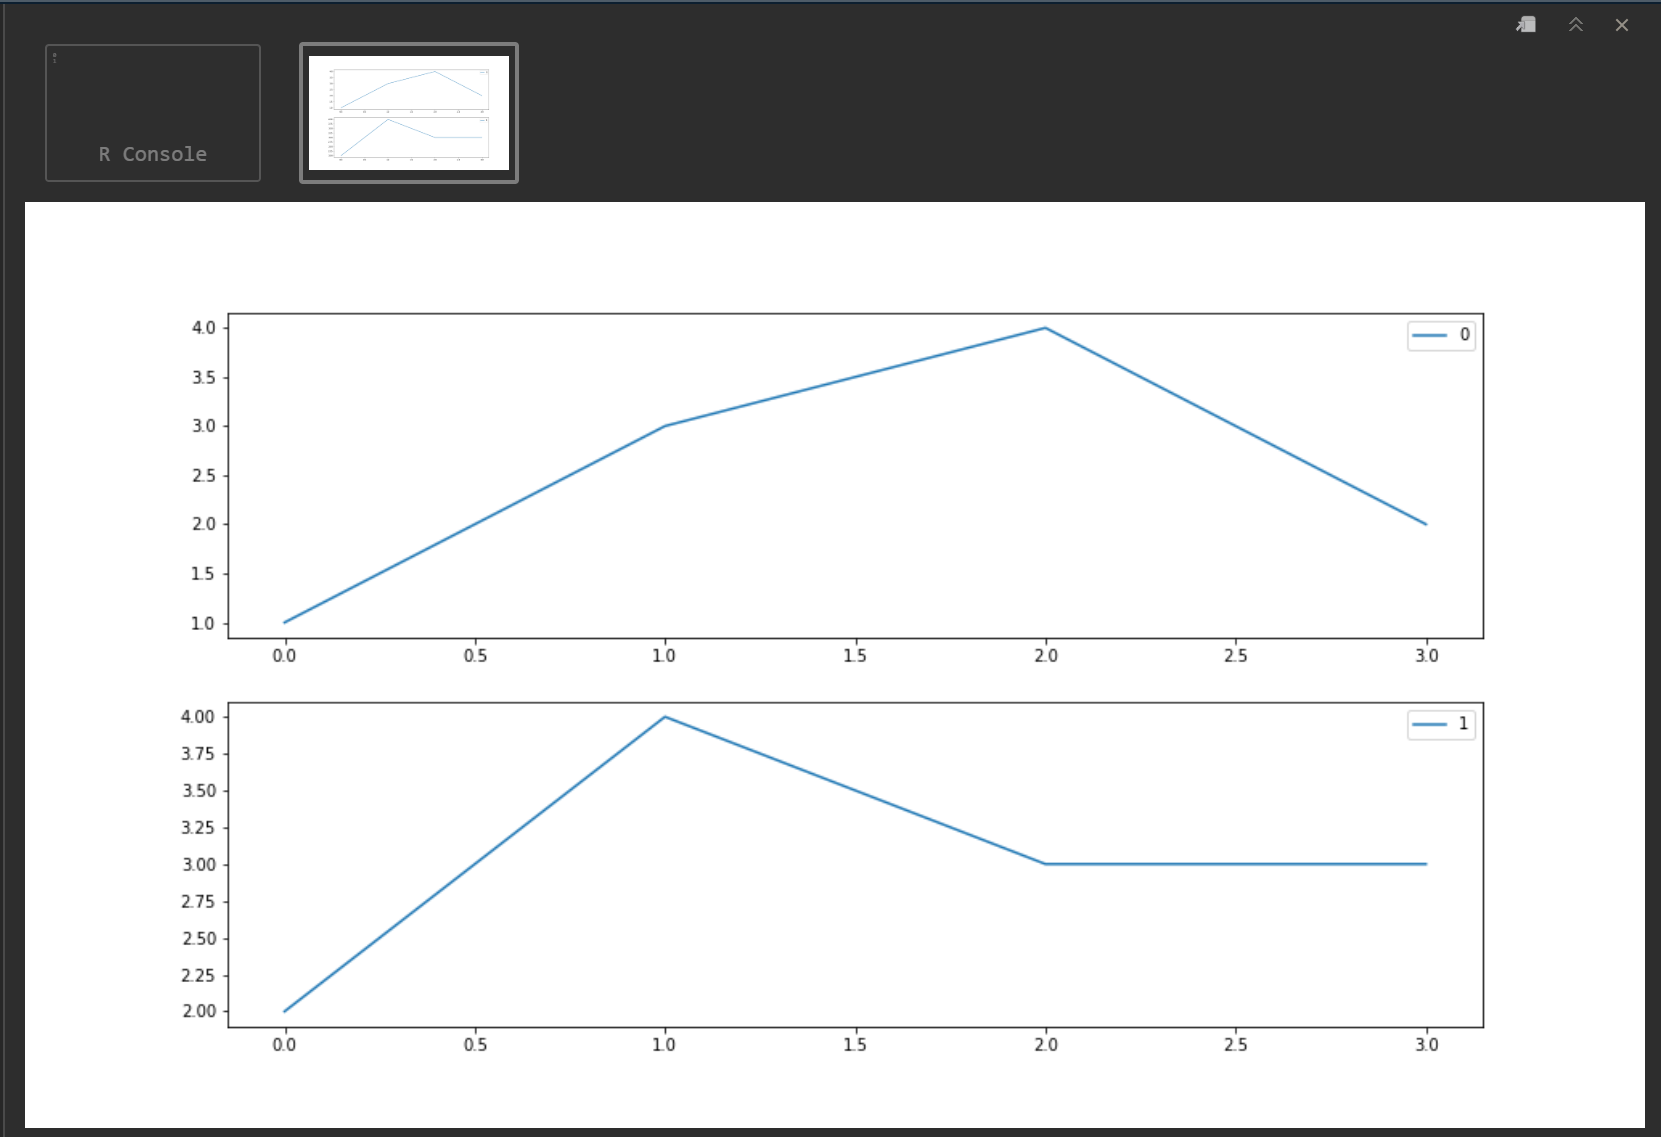
df=pd.DataFrame([[1, 2], [3, 4], [4, 3], [2, 3]])
fig = plt.figure(figsize=(14,8))
for i in df.columns:
ax=plt.subplot(2,1,i+1)
df[[i]].plot(ax=ax)
print(i)
plt.show()
The code is trying to turn R into Jupytr and won't work. See R Interface to Pythonplot and ggplot just don't know how to render plt.show() Work the example in the link to see how to get where you want to go.
Quick roadmap: have a python function to generate your df, use source_python bring it into the R environment and from there lay out your plots using either ploy or ggplot