Hello!
I am trying to visualize some spatial data with categories that have some NA values. But I keep getting the warning message telling me that it has removed rows containing missing values.
Warning message:
Removed 7 rows containing missing values (geom_sf).
However, it still shows that there are NA values in the category, but doesn't plot them, as shown below.
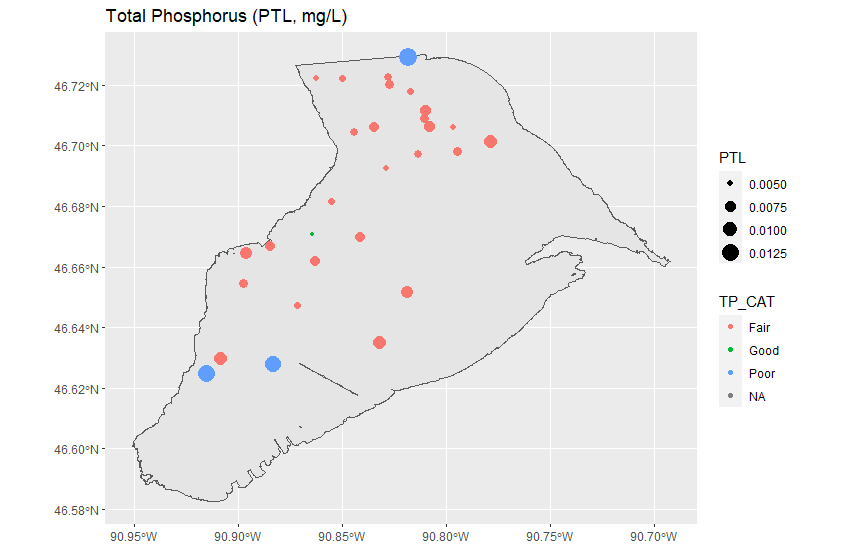
I want ggplot to plot the location of those points but assign them to that NA category that has a grey color value. I tried na.rm = F, but that's a default parameter, and I don't see a way to tell it not to remove those points from the plot.
Here is my code:
tp.plot <- ggplot() +
  geom_sf(data=cb1) +
  geom_sf(data=sf.cat, aes(col=TP_CAT, size=PTL), na.rm=F) +
  labs(title = "Total Phosphorus (PTL, mg/L)")
Where cb1 is an sf of the shoreline and sf.cat is an sf with the data.
Any help would be greatly appreciated.
Thanks so much!