Sorry, still can't reproduce the problem
skin <- data.frame(
State =
c("Alabama", "Arizona", "Arkansas", "California", "Colorado", "Connecticut", "Delaware", "D.C.", "Florida", "Georgia", "Idaho", "Illinois", "Indiana", "Iowa", "Kansas", "Kentucky", "Louisiana", "Maine", "Maryland", "Massachusetts", "Michigan", "Minnesota", "Mississippi", "Missouri", "Montana", "Nebraska", "Nevada", "NewHampshire", "NewJersey", "NewMexico", "MewYork", "NorthCarolina", "NorthDakota", "Ohio", "Oklahoma", "Oregon", "Pennsylvania", "RhodeIsland", "SouthCarolina", "SouthDakota", "Tennessee", "Texas", "Utah", "Vermont", "Virginia", "Washington", "WestVirginia", "Wisconsin", "Wyoming"),
Lat =
c(33, 34.5, 35, 37.5, 39, 41.8, 39, 39, 28, 33, 44.5, 40, 40.2, 42.2, 38.5, 37.8, 31.2, 45.2, 39, 42.2, 43.5, 46, 32.8, 38.5, 47, 41.5, 39, 43.8, 40.2, 35, 43, 35.5, 47.5, 40.2, 35.5, 44, 40.8, 41.8, 33.8, 44.8, 36, 31.5, 39.5, 44, 37.5, 47.5, 38.8, 44.5, 43),
Mort =
c(219, 160, 170, 182, 149, 159, 200, 177, 197, 214, 116, 124, 128, 128, 166, 147, 190, 117, 162, 143, 117, 116, 207, 131, 109, 122, 191, 129, 159, 141, 152, 199, 115, 131, 182, 136, 132, 137, 178, 86, 186, 229, 142, 153, 166, 117, 136, 110, 134),
Ocean =
c(1, 0, 0, 1, 0, 1, 1, 0, 1, 1, 0, 0, 0, 0, 0, 0, 1, 1, 1, 1, 0, 0, 1, 0, 0, 0, 0, 1, 1, 0, 1, 1, 0, 0, 0, 1, 0, 1, 1, 0, 0, 1, 0, 1, 1, 1, 0, 0, 0),
Long =
c(87, 112, 92.5, 119.5, 105.5, 72.8, 75.5, 77, 82, 83.5, 114, 89.5, 86.2, 93.8, 98.5, 85, 91.8, 69, 76.5, 71.8, 84.5, 94.5, 90, 92, 110.5, 99.5, 117, 71.5, 74.5, 106, 75.5, 79.5, 100.5, 82.8, 97.2, 120.5, 77.8, 71.5, 81, 100, 86.2, 98, 111.5, 72.5, 78.5, 121, 80.8, 90.2, 107.5)
)
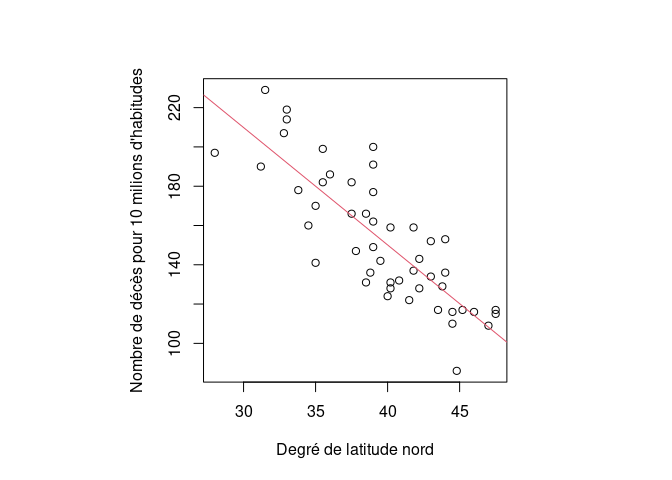
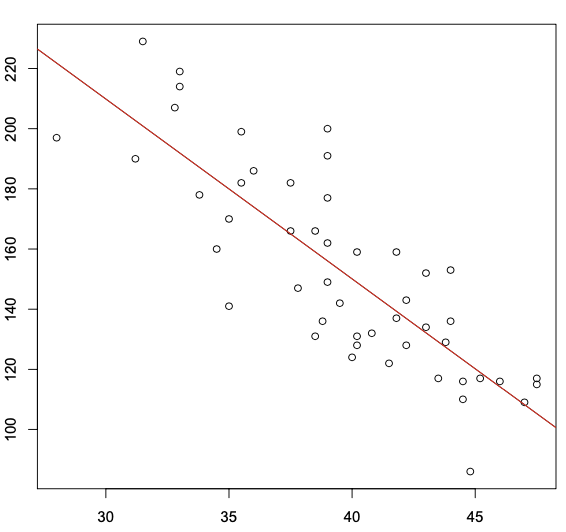
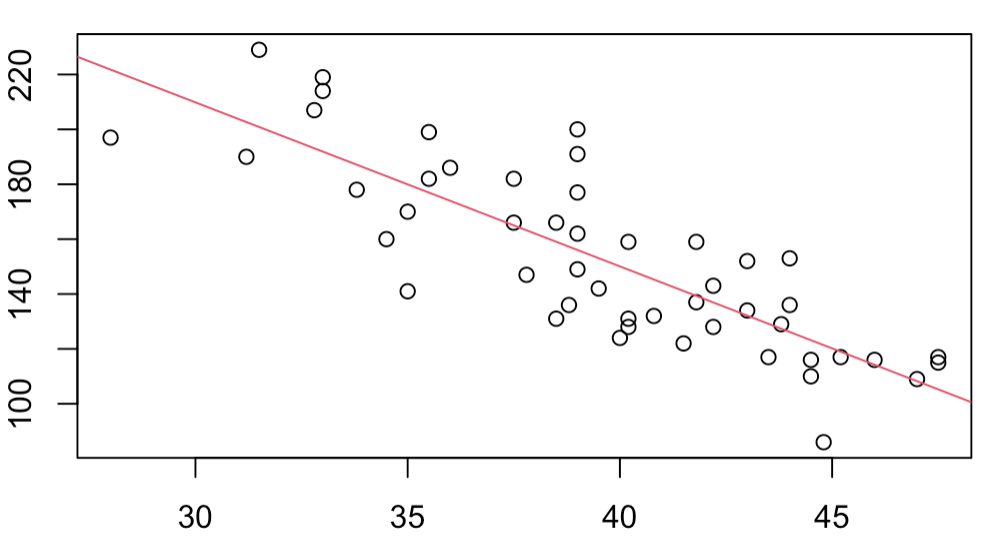
fit <- lm(Mort ~ Lat, data = skin)
par(pty="s")
plot(skin$Lat, skin$Mort,
xlab = "Degré de latitude nord",
ylab = "Nombre de décès pour 10 milions d'habitudes")
abline(fit, col = 2)