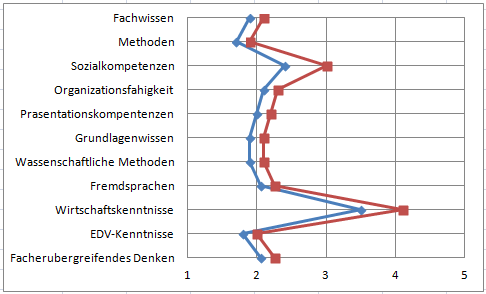
I want to create a Vertical line chart , is there anyway to plot it by ggplot2 or highcharter ?
here is the example chart:
data example :
value1 <- abs(rnorm(26))*2
data <- data.frame(
  x=LETTERS[1:26],
  value1=value1,
  value2=value1+1+rnorm(26, sd=1)
)
There are several ways to achieve this result. I would definitely suggest the tidy one
library(tidyverse)
value1 <- abs(rnorm(26))*2
data <- data.frame(
x=LETTERS[1:26],
value1=value1,
value2=value1+1+rnorm(26, sd=1)
)
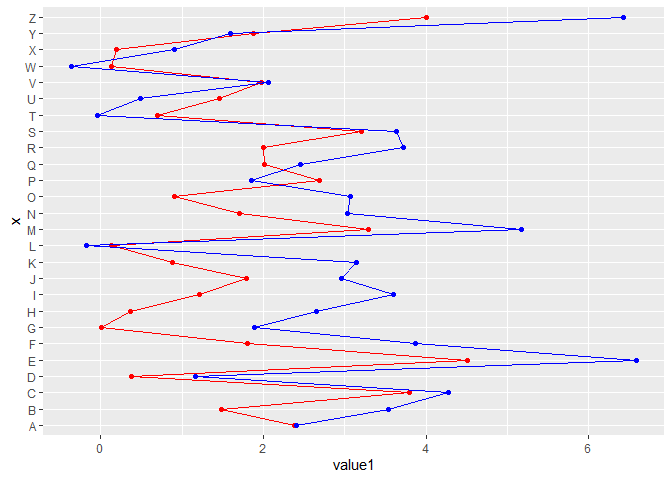
# Option 1: dirty
ggplot(data,
aes(x = x))+
geom_point(aes(y = value1), color = "red")+
geom_line(aes(y = value1, group = 1), color = "red")+
geom_point(aes(y = value2), color = "blue")+
geom_line(aes(y = value2, group = 2), color = "blue")+
coord_flip()
# Option 2: tidy
data %>%
  pivot_longer(cols = c("value1", "value2"),
               names_to = "v_group") %>%
  ggplot(aes(x = x, y = value, color = v_group, group = v_group)) +
  geom_point()+
  geom_line()+
  coord_flip()
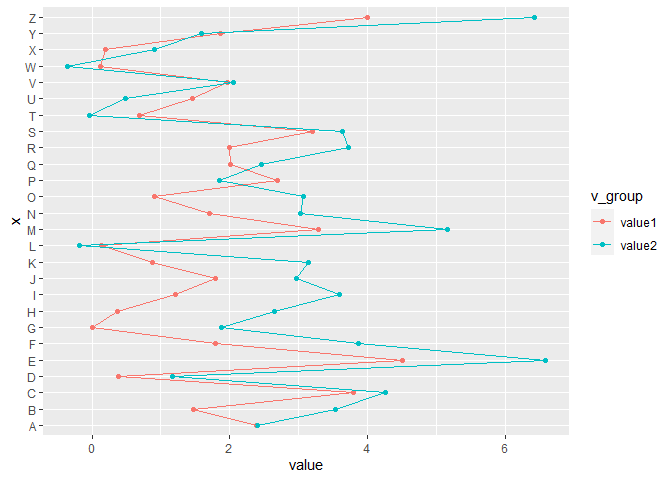
Created on 2021-04-13 by the reprex package (v1.0.0)
system
Closed
3
This topic was automatically closed 7 days after the last reply. New replies are no longer allowed.
If you have a query related to it or one of the replies, start a new topic and refer back with a link.