How to Create Summary Report with Duplicate Totals

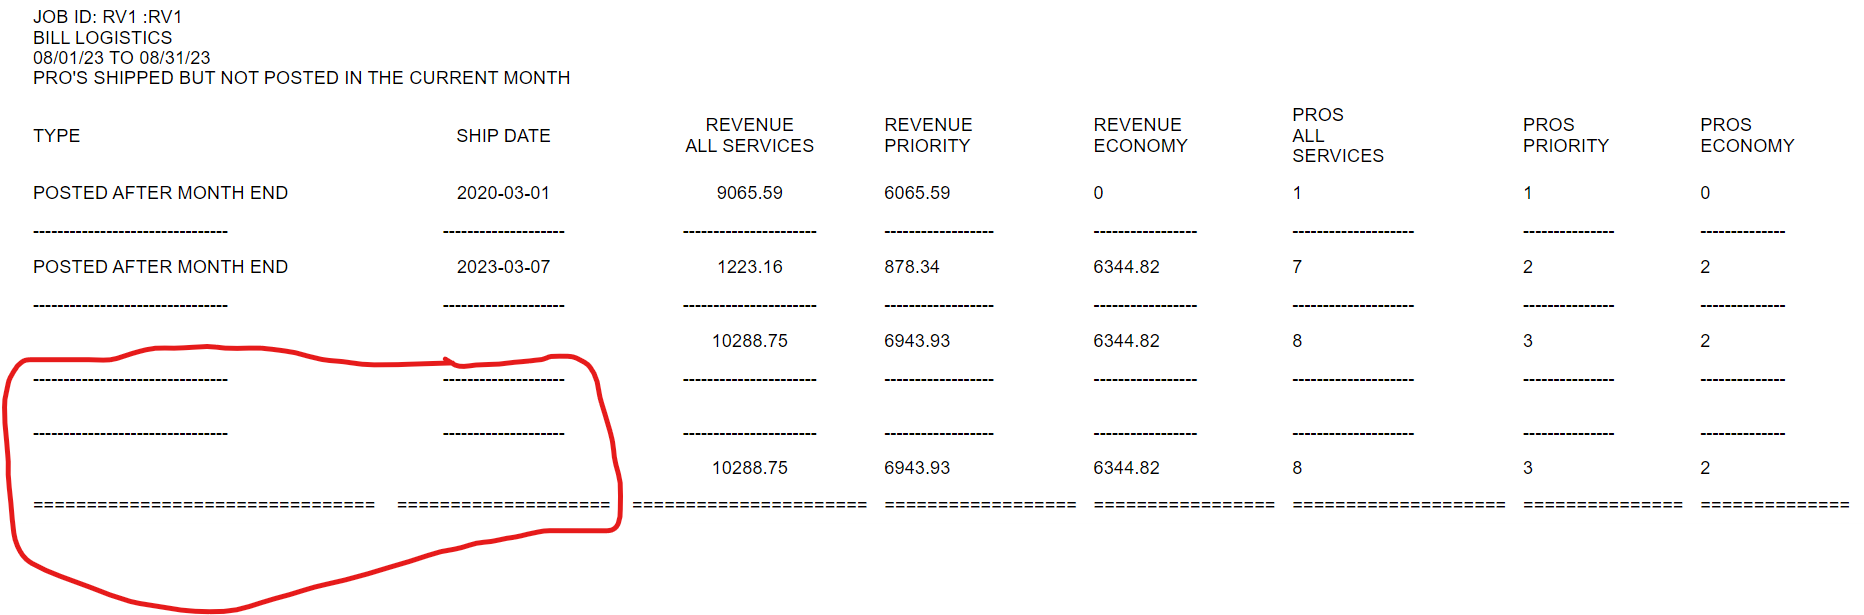
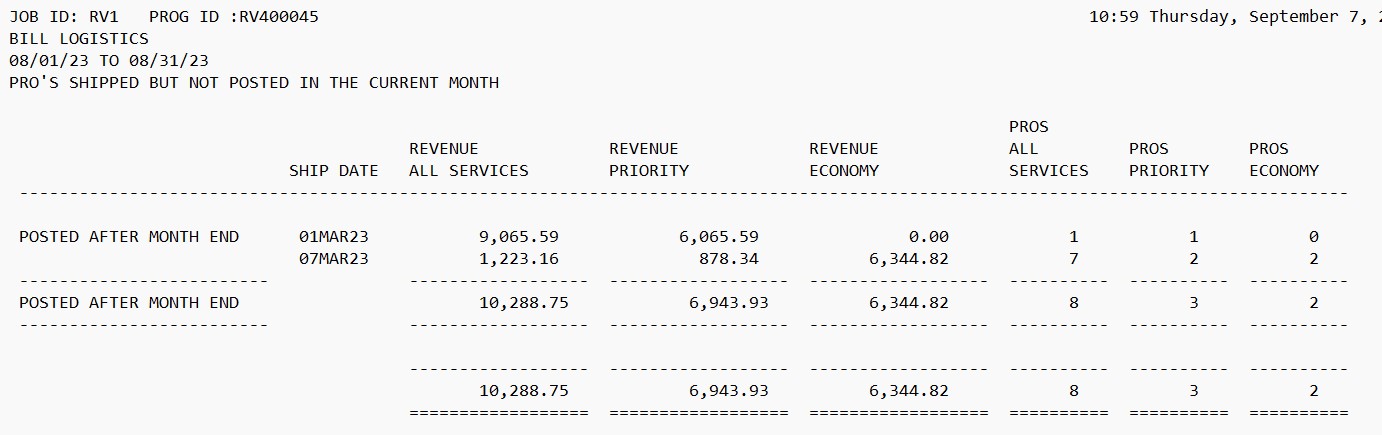
Hi, I want to format a Tabular report. so that it can show two summaries.
The report is required in below format:


I used the below R code:
install.packages("flextable")
install.packages("janitor")
install.packages("officer")
install.packages("dplyr")
library("flextable")
library("officer")
library("magrittr")
library("janitor")
library("dplyr")

df<- read.csv("C:\Users\M68\Downloads\RV1.csv",sep='|',header=TRUE)
#Adding totals
df1<-df%>% adorn_totals("row")
#Keeping only required columns
df1<-subset(df1,select=c(X_type_,shpdt,revenue,revprty,revecon,c,tp,te))
#Renaming column names
colnames(df1) <- c('TYPE','SHIP DATE','REVENUE\n ALL SERVICES','REVENUE\n PRIORITY','REVENUE\n ECONOMY','PROS\n ALL\n SERVICES','PROS\n PRIORITY','PROS\n ECONOMY')
#Adding summary records again
df2<-subset(df1, TYPE=='-' | 'SHIP DATE' == '-')
df2 <- rbind(df1,df2)

#Creating a report
report<-flextable(df2) %>%
#width of columns
width(j=2:3, width=2) %>% width(j=1, width=2.5) %>%
#alignment of columns
align(j=2:3, align="center", part="all") %>%
align(j=1, align="left",part="all") %>%
add_header_lines(values = paste("JOB ID: RV1 :RV1
BILL LOGISTICS
08/01/23 TO 08/31/23
PRO'S SHIPPED BUT NOT POSTED IN THE CURRENT MONTH", strrep(" ", 30), sep = ""))

Im unable to get the desired format result. any help in this

Sometimes the old ways are the best ways. :slight_smile: But also sometimes you need to imitate the past in order to sell a better future. I’ll take a look later today, but check out the {gt} package in the meantime.

Snap. Stuck here. Can you provide actual or fake data with the same layout?

Sure Sir, Here is the Data.
|TYPE|SHIP DATE|REVENUE ALL SERVICES|REVENUE PRIORITY|REVENUE ECONOMY|PROS ALL SERVICES|PROS PRIORITY|PROS ECONOMY|
|POSTED AFTER MONTH END|01-03-2020|9065.59|6065.59|0|1|1|0|
|POSTED AFTER MONTH END|07-03-2023|1223.16|878.34|6344.82|7|2|2|

library("flextable")
library("officer")
library("janitor")
#> 
#> Attaching package: 'janitor'
#> The following objects are masked from 'package:stats':
#> 
#>     chisq.test, fisher.test
library("dplyr")
#> 
#> Attaching package: 'dplyr'
#> The following objects are masked from 'package:stats':
#> 
#>     filter, lag
#> The following objects are masked from 'package:base':
#> 
#>     intersect, setdiff, setequal, union

# This is as it should be all data and no summaries
d <- data.frame(
  TYPE = c("POSTED AFTER MONTH END", "POSTED AFTER MONTH END"),
  SHIP.DATE = c("01-03-2020", "07-03-2023"),
  REVENUE.ALL.SERVICES = c(9065.59, 1223.16),
  REVENUE.PRIORITY = c(6065.59, 878.34),
  REVENUE.ECONOMY = c(0, 6344.82),
  PROS.ALL.SERVICES = c(1, 7),
  PROS.PRIORITY = c(1, 2),
  PROS.ECONOMY = c(0, 2)
)


# create a summary row to be used for the report object
r <- apply(d[3:8],2,sum) 
# add the two character variables
r <- c(NA,NA,r)
# create a data frame with the summary row
ds <- d
ds[3,] <- r
ds
#>                     TYPE  SHIP.DATE REVENUE.ALL.SERVICES REVENUE.PRIORITY
#> 1 POSTED AFTER MONTH END 01-03-2020              9065.59          6065.59
#> 2 POSTED AFTER MONTH END 07-03-2023              1223.16           878.34
#> 3                   <NA>       <NA>             10288.75          6943.93
#>   REVENUE.ECONOMY PROS.ALL.SERVICES PROS.PRIORITY PROS.ECONOMY
#> 1            0.00                 1             1            0
#> 2         6344.82                 7             2            2
#> 3         6344.82                 8             3            2
# adjust flextable as needed to pick up new row
# Creating a report
# report <- flextable(ds) %>%
#   # width of columns
#   width(j = 2:3, width = 2) %>%
#   width(j = 1, width = 2.5) %>%
#   # alignment of columns
#   align(j = 2:3, align = "center", part = "all") %>%
#   align(j = 1, align = "left", part = "all") %>%
#   add_header_lines(values = paste("JOB ID: RV1 :RV1
# BILL LOGISTICS
# 08/01/23 TO 08/31/23
# PRO'S SHIPPED BUT NOT POSTED IN THE CURRENT MONTH", strrep(" ", 30), sep = ""))
# report

Created on 2023-09-22 with reprex v2.0.2

Thanks. actually i was looking for double summary lines. as shown in picture. this output was from SAS programming. So in R i m trying to achieve the same

I probably played with this longer than warranted :smiley:

library("flextable")
library("officer")
library("janitor")
library("tidyverse")

# This is as it should be all data and no summaries
d <- data.frame(
  TYPE = c("POSTED AFTER MONTH END", "POSTED AFTER MONTH END"),
  SHIP.DATE = c("01-03-2020", "07-03-2023"),
  REVENUE.ALL.SERVICES = c(9065.59, 1223.16),
  REVENUE.PRIORITY = c(6065.59, 878.34),
  REVENUE.ECONOMY = c(0, 6344.82),
  PROS.ALL.SERVICES = c(1, 7),
  PROS.PRIORITY = c(1, 2),
  PROS.ECONOMY = c(0, 2)
)


# create a summary row to be used for the report object
r <- apply(d[3:8],2,sum) 
# add the two character variables
r <- c(NA,NA,r)
# create a data frame with the summary row
ds <- d
ds[3,] <- r
ds


# (empty_row <- filter(ds,FALSE))

(title_charlengths <- nchar(names(ds))+1)
names(title_charlengths) <- names(ds)
(smry_of_title_lengths <- enframe(title_charlengths) |> pivot_wider())
(smry_of_var_lengths <- summarise(ds,
                                  across(everything(),\(x)max(nchar(as.character(x)),na.rm = TRUE)+1
                                         ))) # +1 is a small padding - changeable

(charlength_smry <- bind_rows(smry_of_title_lengths,
                             smry_of_var_lengths) |> summarise(across(everything(),
                                                                      max)))


(single_dash_row <- mutate(charlength_smry,
                           across(everything(),
                                  \(n)paste0(rep('-',n),collapse=""))))
(double_dash_row <- mutate(charlength_smry,
                           across(everything(),
                                  \(n)paste0(rep('=',n),collapse=""))))

(single_row_ids <- seq(from=1,by=2,length.out=nrow(ds) - 1))

#give all rows even rowid
ds$rn <- seq(from=0,by=2,length.out=nrow(ds))

(ds2 <- bind_rows(mutate(ds,across(everything(),
                                   as.character)),
                  map_dfr(single_row_ids,
                          \(r){
                            tmp <- single_dash_row
                            tmp$rn <- as.character(r)
                            tmp
                          }
                  )) |> arrange(rn))

(ds3 <- bind_rows(ds2,
                 double_dash_row) |> select(-rn))


report<-flextable(ds3) %>%
  #width of columns
  width(j=2:3, width=2) %>% width(j=1, width=2.5) %>%
  #alignment of columns
  align(j=2:3, align="center", part="all") %>%
  align(j=1, align="left",part="all") %>%
  add_header_lines(values = paste("JOB ID: RV1 :RV1
BILL LOGISTICS
08/01/23 TO 08/31/23
PRO'S SHIPPED BUT NOT POSTED IN THE CURRENT MONTH", strrep(" ", 30), sep = ""))

So?

ds[4,] <- ds[3,]

Neither R nor SAS really fits the problem. Sort of like using a Tesla to haul a boat. This is more the bread and butter of SQL or even awk.

:smiley:
I agree . As i got this requirement of formatting. hence posted it

1 Like

:smiling_face:
Thanks will let you know if it works

Thanks very much both.
I got the output with your help


Any idea if the highlighted blank rows can be deleted.

Code:
install.packages("flextable")
install.packages("janitor")
install.packages("officer")
install.packages("dplyr")
library("flextable")
library("officer")
library("magrittr")
library("janitor")
library("dplyr")

library("flextable")
library("officer")
library("janitor")
library("tidyverse")

d <- data.frame(
TYPE = c("POSTED AFTER MONTH END", "POSTED AFTER MONTH END"),
SHIP.DATE = c("01-03-2020", "07-03-2023"),
REVENUE.ALL.SERVICES = c(9065.59, 1223.16),
REVENUE.PRIORITY = c(6065.59, 878.34),
REVENUE.ECONOMY = c(0, 6344.82),
PROS.ALL.SERVICES = c(1, 7),
PROS.PRIORITY = c(1, 2),
PROS.ECONOMY = c(0, 2)
)

create a summary row to be used for the report object

r <- apply(d[3:8],2,sum)

add the two character variables

r <- c(NA,NA,r)

create a data frame with the summary row

ds <- d
ds[3,] <- r
ds

(empty_row <- filter(ds,FALSE))

(title_charlengths <- nchar(names(ds))+1)
names(title_charlengths) <- names(ds)
(smry_of_title_lengths <- enframe(title_charlengths) |> pivot_wider())
(smry_of_var_lengths <- summarise(ds,
across(everything(),(x)max(nchar(as.character(x)),na.rm = TRUE)+10
))) # +1 is a small padding - changeable

(charlength_smry <- bind_rows(smry_of_title_lengths,
smry_of_var_lengths) |> summarise(across(everything(),
max)))

(single_dash_row <- mutate(charlength_smry,
across(everything(),
(n)paste0(rep('-',n),collapse=""))))
(double_dash_row <- mutate(charlength_smry,
across(everything(),
(n)paste0(rep('=',n),collapse=""))))

(single_row_ids <- seq(from=1,by=2,length.out=nrow(ds) - 1))

#give all rows even rowid
ds$rn <- seq(from=0,by=2,length.out=nrow(ds))

(ds2 <- bind_rows(mutate(ds,across(everything(),
as.character)),
map_dfr(single_row_ids,
(r){
tmp <- single_dash_row
tmp$rn <- as.character(r)
tmp
}
)) |> arrange(rn))

(ds3 <- bind_rows(ds2,
single_dash_row) |> select(-rn))

#adding an empty row
ds3[nrow(ds3) + 1, ] <- " " # Add empty row containing only NA values
(ds4 <- bind_rows(ds3,
single_dash_row))

#adding secong summary row
ds4[9,] <- r

#keeping lines

(ds5 <- bind_rows(ds4,
double_dash_row))

report<-flextable(ds5) %>%
#width of columns
width(j=2:3, width=2) %>% width(j=1, width=2.5) %>%
#alignment of columns
align(j=2:3, align="center", part="all") %>%
align(j=1, align="left",part="all") %>%
add_header_lines(values = paste("JOB ID: RV1 :RV1
BILL LOGISTICS
08/01/23 TO 08/31/23
PRO'S SHIPPED BUT NOT POSTED IN THE CURRENT MONTH", strrep(" ", 30), sep = ""))

report1 <- border_remove(x = report)
big_border = fp_border(color="black",style="dashed")
report2=hline_top(report1,border=big_border)

there would be at least two ways to approach this ;

  1. build the dashed rows differents : - identify the columns that you dont want double_dash_row to include, as it makes the number of dashes out of the info in charlength_smry you can change the numbers in here to zero to have no = placed
  2. replace the contents that you want to change : - identify if the row and column that you want to change and use standard R syntax to replace the contents with empty

general example of how to change a cell in a frame

 (a_frame <- data.frame(matrix(1:4,nrow=2,byrow = TRUE)))
  X1 X2
1  1  2
2  3  4

 a_frame[2,1]

a_frame[2,1] <- 99

a_frame

Sure will check
thanks

This topic was automatically closed 42 days after the last reply. New replies are no longer allowed.

If you have a query related to it or one of the replies, start a new topic and refer back with a link.