How to create one checkbox that check/de-check a group of checkboxes in Shiny?

Hi all

I am working a while on a Shiny app.
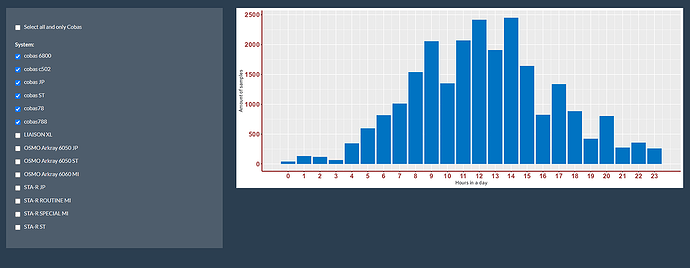
I have the all-Cobas checkbox above and when it is checked, it should check all the checkboxes in the checkboxgroup containing "Cobas", also in the de-check direction.

When they are all checked, is it possible to de-check on of the group? Like Cobas 6800 is not always needed for the analysis.

e.g: check the all_cobas checkbox -> result is like in picture.
de-check Cobas 6800 -> all_cobas checkbox is de-checked again.

This is mine UI of that chunk:

tabPanel("Distribution based on SYSTEM", icon = icon("fa-duotone fa-microscope", verify_fa = FALSE),
                                    sidebarLayout(
                                      sidebarPanel(
                                        checkboxInput("all_cobas", label = "Select all and only Cobas", value = FALSE),
                                        checkboxGroupInput("system", "System:", choices = NULL, selected = NULL)),
                                      mainPanel(
                                        plotOutput("barplot3")))),

This is mine server chunk:

 updateCheckboxGroupInput(session, 'system', label = NULL, choices = sort(unique(df1$InstrumentName)),
                                                 selected = 1, inline = FALSE)
    
    output$barplot3 <- renderPlot({
        
        if(input$all_cobas == TRUE) {
          df1_filtered <- df1[grep("cobas", df1$InstrumentName), ]
        }
        else {
          df1_filtered <- df1[df1$InstrumentName %in% input$system,]
        }
        
        #Calculate the amount of Result-samples each hour:
        hours_set <- hms(df1_filtered$ResultTime)
        df2 <- as.data.frame(hours_set$hour)
        df_aggr_Result <- aggregate(df2, by=list(df2$`hours_set$hour`), FUN = length)
        #Renaming
        names(df_aggr_Result)[names(df_aggr_Result) == "Group.1"] <- "hour"
        names(df_aggr_Result)[names(df_aggr_Result) == "hours_set$hour"] <- "amount of samples"
        
        all_h <- tibble(hour = 0:23)
        
        df_plot = merge(x=all_h,y=df_aggr_Result,by="hour",all=TRUE)
        df_plot[is.na(df_plot)] <- 0
        
        ggplot(df_plot, aes(x = df_plot$hour, y = df_plot$`amount of samples`)) +
          geom_bar(fill = "#0073C2FF", stat = "identity") +
          theme(axis.text.x = element_text(face = "bold", color = "#993333", size = 15),
                axis.text.y = element_text(face = "bold", color = "#993333", size = 15),
                axis.line = element_line(color = "#993333", size = 1)) +
          scale_x_continuous(breaks=seq(0,23,1)) +
          xlab("Hours in a day") + ylab("Amount of samples")
    })  
    

Thanks in advance!

If you add the code below to your server section, each time the all-Cobas checkbox at the top is clicked, it will add or remove all Cobas selections from the current checkboxGroup.

observeEvent(input$all_cobas, {
    
    choices = sort(df1$InstrumentName)
    selected = sort(input$system)
    
    if(input$all_cobas == TRUE) {
      # current selection + all cobas
      new_selection = c(selected, choices[str_detect(choices, 'cobas')])
    } else {
      # remove all cobas from current selected
      new_selection = selected[!str_detect(selected, 'cobas')]
    }
    
    updateCheckboxGroupInput(session, 
                             'system', 
                             label = NULL, 
                             choices = choices, 
                             selected = new_selection,
                             inline = FALSE)
    
  }, ignoreNULL = T)

Hi
Thank you for your quick response. It doesn't seems to work, al my interactivity stops with this code. I tried some debugging and I think that the problem is to give the content of your new checkboxgroup to the df1_filtered datafram.

This is the directions that we needs to go (or this is what I think).

 output$barplot3 <- renderPlot({
      
      choices = sort(df1$InstrumentName)
      selected = sort(input$system)
      
      if(input$all_cobas == TRUE) {
        # current selection + all cobas
        new_selection = c(selected, choices[str_detect(choices, 'cobas')])
      }
      else {
        # remove all cobas from current selected
        new_selection = selected[!str_detect(selected, 'cobas')]
        
        updateCheckboxGroupInput(session, 
                                 'system', 
                                 label = NULL, 
                                 choices = choices, 
                                 selected = new_selection,
                                 inline = FALSE)
        
        df1_filtered <- df1[df1$InstrumentName %in% input$system,]
      }
    
        #Calculate the amount of Result-samples each hour:
        hours_set <- hms(df1_filtered$ResultTime)
        df2 <- as.data.frame(hours_set$hour)
        df_aggr_Result <- aggregate(df2, by=list(df2$`hours_set$hour`), FUN = length)
        #Renaming
        names(df_aggr_Result)[names(df_aggr_Result) == "Group.1"] <- "hour"
        names(df_aggr_Result)[names(df_aggr_Result) == "hours_set$hour"] <- "amount of samples"
        
        all_h <- tibble(hour = 0:23)
        
        df_plot = merge(x=all_h,y=df_aggr_Result,by="hour",all=TRUE)
        df_plot[is.na(df_plot)] <- 0
        
        ggplot(df_plot, aes(x = df_plot$hour, y = df_plot$`amount of samples`)) +
          geom_bar(fill = "#0073C2FF", stat = "identity") +
          theme(axis.text.x = element_text(face = "bold", color = "#993333", size = 15),
                axis.text.y = element_text(face = "bold", color = "#993333", size = 15),
                axis.line = element_line(color = "#993333", size = 1)) +
          scale_x_continuous(breaks=seq(0,23,1)) +
          xlab("Hours in a day") + ylab("Amount of samples")
    })  

Thank you!

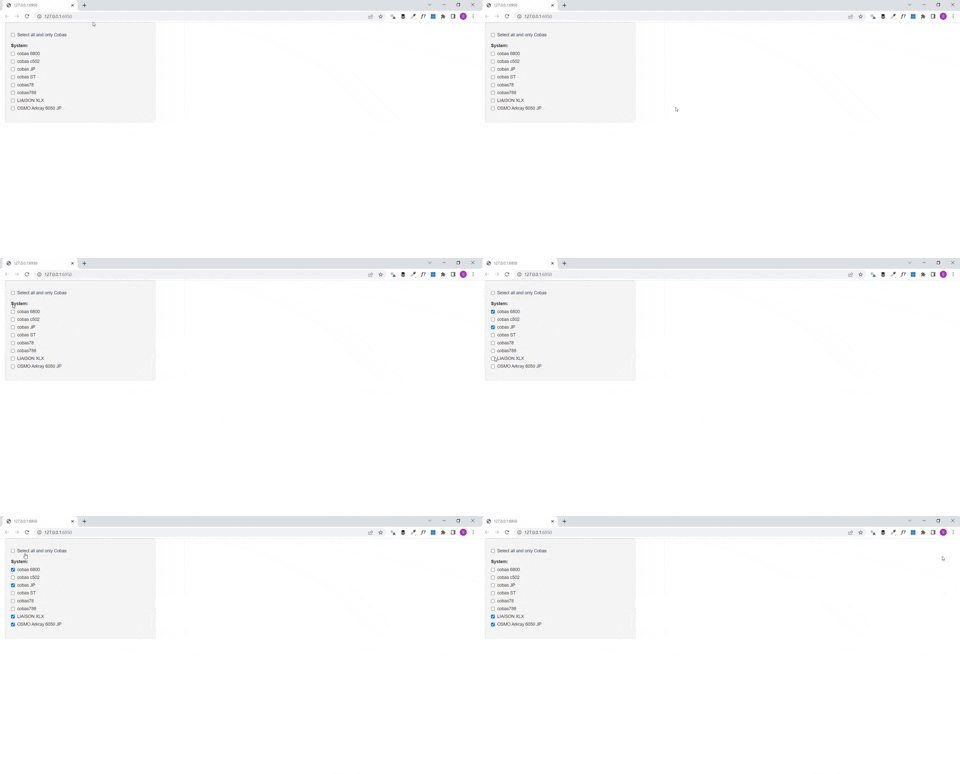
Below is the entire server section used in the gif below. As you can see, the current configuration checks or unchecks all Cobas options, preserving any other non-Cobas option that is selected. Since I don't have the df1 dataset, I commented out the plot in the ui (hence, it's missing in the gif). If the plot is the issue, then please share the data and I can help troubleshoot.

server <- function(input, output, session) {
  
  observeEvent(input$all_cobas, {
    
    choices = sort(df1$InstrumentName)
    selected = sort(input$system)
    
    if(input$all_cobas == TRUE) {
      # current selection + all cobas
      new_selection = c(selected, choices[str_detect(choices, 'cobas')])
    } else {
      # remove all cobas from current selected
      new_selection = selected[!str_detect(selected, 'cobas')]
    }
    
    updateCheckboxGroupInput(session, 
                             'system', 
                             label = NULL, 
                             choices = choices, 
                             selected = new_selection,
                             inline = FALSE)
    
  }, ignoreNULL = T)


  output$barplot3 <- renderPlot({
    
    if(input$all_cobas == TRUE) {
      df1_filtered <- df1[grep("cobas", df1$InstrumentName), ]
    }
    else {
      df1_filtered <- df1[df1$InstrumentName %in% input$system,]
    }
    
    #Calculate the amount of Result-samples each hour:
    hours_set <- hms(df1_filtered$ResultTime)
    df2 <- as.data.frame(hours_set$hour)
    df_aggr_Result <- aggregate(df2, by=list(df2$`hours_set$hour`), FUN = length)
    #Renaming
    names(df_aggr_Result)[names(df_aggr_Result) == "Group.1"] <- "hour"
    names(df_aggr_Result)[names(df_aggr_Result) == "hours_set$hour"] <- "amount of samples"
    
    all_h <- tibble(hour = 0:23)
    
    df_plot = merge(x=all_h,y=df_aggr_Result,by="hour",all=TRUE)
    df_plot[is.na(df_plot)] <- 0
    
    ggplot(df_plot, aes(x = df_plot$hour, y = df_plot$`amount of samples`)) +
      geom_bar(fill = "#0073C2FF", stat = "identity") +
      theme(axis.text.x = element_text(face = "bold", color = "#993333", size = 15),
            axis.text.y = element_text(face = "bold", color = "#993333", size = 15),
            axis.line = element_line(color = "#993333", size = 1)) +
      scale_x_continuous(breaks=seq(0,23,1)) +
      xlab("Hours in a day") + ylab("Amount of samples")
  })  
  
}

gif posit community

Hi

The problem remains, I think it has to do with the fact that I am working with an fileinput/upload. It has an ObserveEvent over the whole server chunk. If a file is uploaded, the whole first ObserveEvent is executed (all the processing and visualizations.

It seems like If I add an extra OberveEvent for this problem, it is an nested ObserveEvent. Is this possible in R? I don't get an error or a warning, the Shiny app does no processing, it feels like it is looping somewhere. Maybe the this nested ObserveEvent is the because?


server = shinyServer(function(input, output,session){
  
  ##########################################################################################################################################################################################################################################################################
  ########FILE UPLOAD#############################################################################################################################################################################################################
  ##########################################################################################################################################################################################################################################################################
  #FILE UPLOAD:
  
  observeEvent(input$import, {
    file1 <- input$import
    server_data <- read.delim(file=file1$datapath, header = TRUE, na.strings=c(""," ","NA"))
    #Create a subset of the data to remove/exclude the unnecessary columns:
    subset_data_server <- server_data[,c(-5,-7,-9,-17,-25:-31)]
    #Remove the rows with blank/NA values:
    df1 <- na.omit(subset_data_server)
    #The difference between the ResultTime and the FirstScanTime is the turn around time:
    df1$TS_start <- paste(df1$FirstScanDate, df1$FirstScanTime)
    df1$TS_end <- paste(df1$ResultDate, df1$ResultTime)
    df1$TAT <- difftime(df1$TS_end,df1$TS_start,units = "mins")
    #Compute the difference in Firstscan time and test registration time, if this is positive, the order is create before the scan
    #thus a regular test, if this is negative the order is create after the sample is in the lab, this is an upon request:
    df1$TS_request <- paste(df1$TestRegistrationDate, df1$TestRegistrationTime)
    df1$upon_requestTime <- difftime(df1$TS_start, df1$TS_request, units = "mins")
    
    df1$upon_request <- sub('mins','',df1$upon_requestTime)
    df1$upon_request<-replace(df1$upon_request, df1$upon_request>0,"no")
    df1$upon_request<-replace(df1$upon_request, df1$upon_request<0,"yes")
    #write.csv(df1, "G:/My Drive/Traineeship Advanced Bachelor of Bioinformatics 2022/Internship 2022-2023/internship documents\\df1.csv", row.names = TRUE)
    
    #Extract the date of the data out of the file
    output$date <- renderText( 
      server_data[2, 'FirstScanDate']
      )
    
    ##########################################################################################################################################################################################################################################################################
    ########DISTRIBUTION Over the DAY#############################################################################################################################################################################################################
    ##########################################################################################################################################################################################################################################################################
    #DISTRIBUTION:
    
    updateSelectizeInput(session, 'material', choices = df1$Material, server = TRUE)
    
    output$barplot1 <- renderPlot({
      if (input$material!=""){
        
        df1_filtered <- df1[df1$Material == input$material,]
        
        #Calculate the amount of Result-samples each hour:
        hours_set <- hms(df1_filtered$ResultTime)
        df2 <- as.data.frame(hours_set$hour)
        df_aggr_Result <- aggregate(df2, by=list(df2$`hours_set$hour`), FUN = length)
        #Renaming
        names(df_aggr_Result)[names(df_aggr_Result) == "Group.1"] <- "hour"
        names(df_aggr_Result)[names(df_aggr_Result) == "hours_set$hour"] <- "amount of samples"
        
        all_h <- tibble(hour = 0:23)
        
        df_plot = merge(x=all_h,y=df_aggr_Result,by="hour",all=TRUE)
        df_plot[is.na(df_plot)] <- 0
        
        ggplot(df_plot, aes(x = df_plot$hour, y = df_plot$`amount of samples`)) +
          geom_bar(fill = "#0073C2FF", stat = "identity") +
          theme(axis.text.x = element_text(face = "bold", color = "#993333", size = 15),
                axis.text.y = element_text(face = "bold", color = "#993333", size = 15),
                axis.line = element_line(color = "#993333", size = 1)) +
          scale_x_continuous(breaks=seq(0,23,1)) +
          xlab("Hours in a day") + ylab("Amount of samples")
      }
    })  
    
    updateSelectizeInput(session, 'test', choices = df1$TestName, server = TRUE)
    
    output$barplot2 <- renderPlot({
      if (input$test!=""){
        
        df1_filtered <- df1[df1$TestName == input$test,]
        
        #Calculate the amount of Result-samples each hour:
        hours_set <- hms(df1_filtered$ResultTime)
        df2 <- as.data.frame(hours_set$hour)
        df_aggr_Result <- aggregate(df2, by=list(df2$`hours_set$hour`), FUN = length)
        #Renaming
        names(df_aggr_Result)[names(df_aggr_Result) == "Group.1"] <- "hour"
        names(df_aggr_Result)[names(df_aggr_Result) == "hours_set$hour"] <- "amount of samples"
        
        all_h <- tibble(hour = 0:23)
        
        df_plot = merge(x=all_h,y=df_aggr_Result,by="hour",all=TRUE)
        df_plot[is.na(df_plot)] <- 0
        
        ggplot(df_plot, aes(x = df_plot$hour, y = df_plot$`amount of samples`)) +
          geom_bar(fill = "#0073C2FF", stat = "identity") +
          theme(axis.text.x = element_text(face = "bold", color = "#993333", size = 15),
                axis.text.y = element_text(face = "bold", color = "#993333", size = 15),
                axis.line = element_line(color = "#993333", size = 1)) +
          scale_x_continuous(breaks=seq(0,23,1)) +
          xlab("Hours in a day") + ylab("Amount of samples")
      }
    })  
  
    updateCheckboxGroupInput(session, 'system', label = NULL, choices = sort(unique(df1$InstrumentName)),
                             selected = 1, inline = FALSE)
    
    
    output$barplot3 <- renderPlot({
      
      if(input$all_cobas == TRUE) {
        df1_filtered <- df1[grep("cobas", df1$InstrumentName), ]
      }
      else {
        df1_filtered <- df1[df1$InstrumentName %in% input$system,]
      }
    
        #Calculate the amount of Result-samples each hour:
        hours_set <- hms(df1_filtered$ResultTime)
        df2 <- as.data.frame(hours_set$hour)
        df_aggr_Result <- aggregate(df2, by=list(df2$`hours_set$hour`), FUN = length)
        #Renaming
        names(df_aggr_Result)[names(df_aggr_Result) == "Group.1"] <- "hour"
        names(df_aggr_Result)[names(df_aggr_Result) == "hours_set$hour"] <- "amount of samples"
        
        all_h <- tibble(hour = 0:23)
        
        df_plot = merge(x=all_h,y=df_aggr_Result,by="hour",all=TRUE)
        df_plot[is.na(df_plot)] <- 0
        
        ggplot(df_plot, aes(x = df_plot$hour, y = df_plot$`amount of samples`)) +
          geom_bar(fill = "#0073C2FF", stat = "identity") +
          theme(axis.text.x = element_text(face = "bold", color = "#993333", size = 15),
                axis.text.y = element_text(face = "bold", color = "#993333", size = 15),
                axis.line = element_line(color = "#993333", size = 1)) +
          scale_x_continuous(breaks=seq(0,23,1)) +
          xlab("Hours in a day") + ylab("Amount of samples")
    })  
    
    updateSelectizeInput(session, 'location', choices = df1$SourceDesc, server = TRUE)
    
    output$barplot4 <- renderPlot({
      if (input$location!=""){
        
        df1_filtered <- df1[df1$SourceDesc == input$location,]
        
        #Calculate the amount of Result-samples each hour:
        hours_set <- hms(df1_filtered$ResultTime)
        df2 <- as.data.frame(hours_set$hour)
        df_aggr_Result <- aggregate(df2, by=list(df2$`hours_set$hour`), FUN = length)
        #Renaming
        names(df_aggr_Result)[names(df_aggr_Result) == "Group.1"] <- "hour"
        names(df_aggr_Result)[names(df_aggr_Result) == "hours_set$hour"] <- "amount of samples"
        
        all_h <- tibble(hour = 0:23)
        
        df_plot = merge(x=all_h,y=df_aggr_Result,by="hour",all=TRUE)
        df_plot[is.na(df_plot)] <- 0
        
        ggplot(df_plot, aes(x = df_plot$hour, y = df_plot$`amount of samples`)) +
          geom_bar(fill = "#0073C2FF", stat = "identity") +
          theme(axis.text.x = element_text(face = "bold", color = "#993333", size = 15),
                axis.text.y = element_text(face = "bold", color = "#993333", size = 15),
                axis.line = element_line(color = "#993333", size = 1)) +
          scale_x_continuous(breaks=seq(0,23,1)) +
          xlab("Hours in a day") + ylab("Amount of samples")
      }
    })  
    
    updateSelectizeInput(session, 'validation', choices = df1$ValidationUser, server = TRUE)
    
    output$barplot5 <- renderPlot({
      if (input$validation!=""){
        
        df1_filtered <- df1[df1$ValidationUser == input$validation,]
        
        #Calculate the amount of Result-samples each hour:
        hours_set <- hms(df1_filtered$ResultTime)
        df2 <- as.data.frame(hours_set$hour)
        df_aggr_Result <- aggregate(df2, by=list(df2$`hours_set$hour`), FUN = length)
        #Renaming
        names(df_aggr_Result)[names(df_aggr_Result) == "Group.1"] <- "hour"
        names(df_aggr_Result)[names(df_aggr_Result) == "hours_set$hour"] <- "amount of samples"
        
        all_h <- tibble(hour = 0:23)
        
        df_plot = merge(x=all_h,y=df_aggr_Result,by="hour",all=TRUE)
        df_plot[is.na(df_plot)] <- 0
        
        ggplot(df_plot, aes(x = df_plot$hour, y = df_plot$`amount of samples`)) +
          geom_bar(fill = "#0073C2FF", stat = "identity") +
          theme(axis.text.x = element_text(face = "bold", color = "#993333", size = 15),
                axis.text.y = element_text(face = "bold", color = "#993333", size = 15),
                axis.line = element_line(color = "#993333", size = 1)) +
          scale_x_continuous(breaks=seq(0,23,1)) +
          xlab("Hours in a day") + ylab("Amount of samples")
      }
    })  
  })
})

This is the link to the df1.csv:

https://drive.google.com/file/d/1YsicgQdnSM5Iy4xOmAmdtqQDeXx5LRlZ/view?usp=share_link
This topic was automatically closed 54 days after the last reply. New replies are no longer allowed.

If you have a query related to it or one of the replies, start a new topic and refer back with a link.