Hello I am trying to create a multiple regression but know nothing about using ggplot2 and don't even know if I can use it for my data because they have different data ranges, could someone please help me with the code to try or recommend another package to use if i can't use ggplot2. I am trying to plot species against area, distance to mainland and distance to nearest island and I am using the abbreviations s,a,dm and dn in my data. I don't think these have an interaction, someone please help me write the code!
What have you tried? Maybe you should post an example of your data and what you have done.
3 Likes
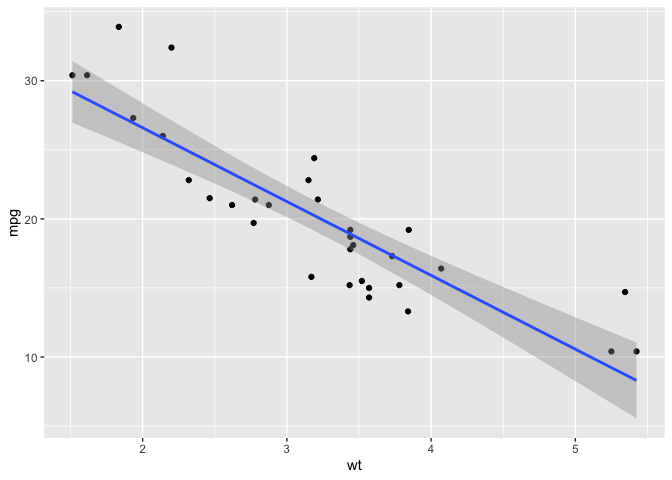
There's a great quick-look ggplot for x,y data that will give a quick look at y ~ x with an lm smoother. Using the famous mtcars dataset
suppressPackageStartupMessages(library(dplyr))
suppressPackageStartupMessages(library(ggplot2))
mtcars %>% select(mpg,wt) -> dat
p <- ggplot(dat, aes(wt,mpg))
p + geom_point() + geom_smooth(method="lm")
Created on 2020-03-02 by the reprex package (v0.3.0)
You can also create a line showing the intercept and slope from the lm model and various diagnostic plots.
1 Like
This topic was automatically closed 21 days after the last reply. New replies are no longer allowed.