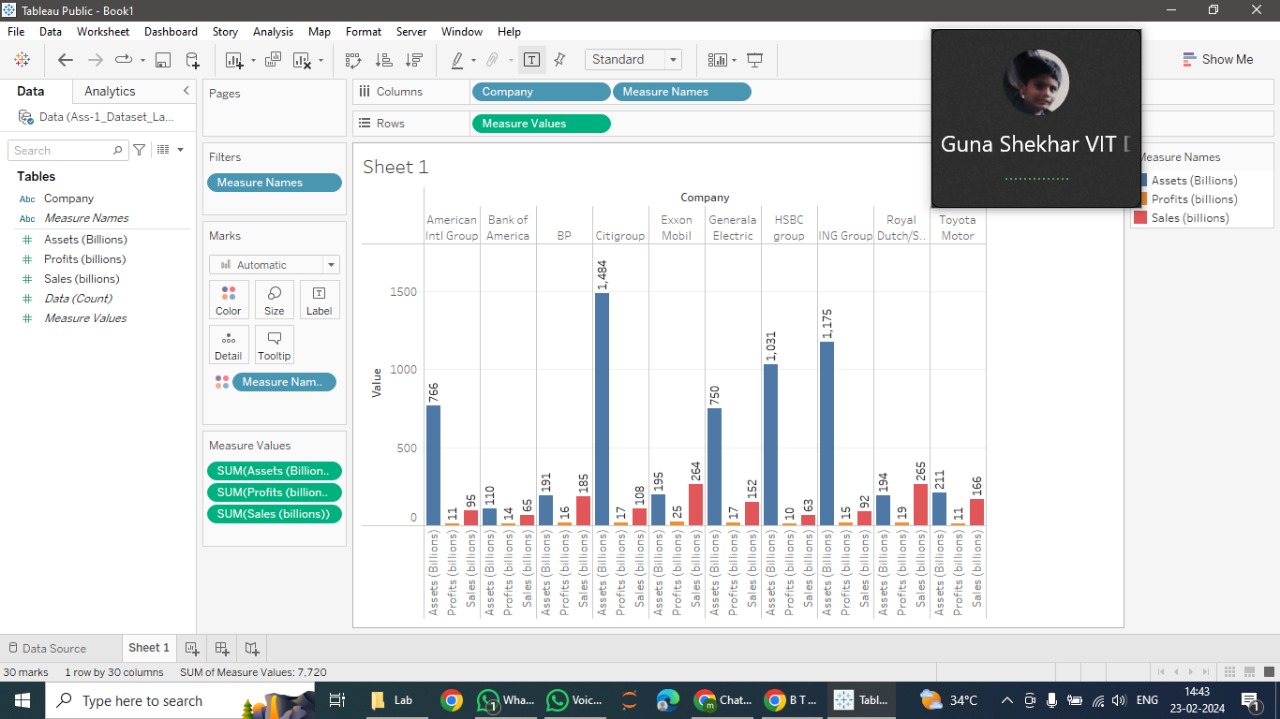
Hi folks, first of all i'm new to the community. I wanna create something with ggplot as follows:-
I have tried do that with the following code:-
    geom_col(aes(y = sales, fill = "Sales"), na.rm = TRUE) +
    geom_col(aes(y = profits, fill = "Profits"), na.rm = TRUE) +
    geom_col(aes(y = assets, fill = "Assets"), na.rm = TRUE) +
    scale_fill_manual(values = c("Sales" = "red", "Profits" = "blue", "Assets" = "green"),
                      name = "Variable") +
    theme(axis.text.x = element_text(angle = 45, hjust = 1))
The above code is not giving the desired output
Could anyone help me out ???
Thnaks in advance
Guna Sekhar
You can read how to create ggplot2's in this book https://r4ds.had.co.nz/
Chapter 3.
hi @nirgrahamuk . In the book they only mentioned for one variable in 3.8. But my case is something different. Anyways thanks for sharing the link.
Something like this :
library(tidyverse)


(example_data <- data.frame(
  companies = letters[1:3],
  profits = 1:3,
  sales = 3:1 ,
  assets = c(5,7,6)
))


(long_data <- pivot_longer(example_data,
                          cols = -companies))


# classic
ggplot(data=long_data) +
  aes(x=companies,
      y=value,
      fill=name) + geom_col(position = position_dodge())


# unusual

(unusual_long <- mutate(arrange(long_data,companies),
                        xcat = as.factor(paste(companies,name,sep = " "))))

ggplot(data=unusual_long) +
  aes(x=xcat,
      y=value,
      fill=name) + geom_col(position=position_dodge())
secondary x-axis' are quite rare and not so well supported. perhaps there are extension packages that would help.
tq @nirgrahamuk . may i know how to print the value on the top of each bar and how to add space after every three bars, i mean every x label
system
Closed
6
This topic was automatically closed 7 days after the last reply. New replies are no longer allowed.
If you have a query related to it or one of the replies, start a new topic and refer back with a link.