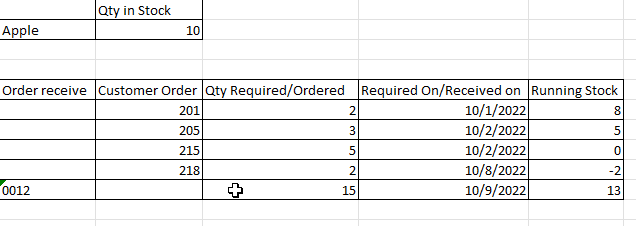
I wish to know how we can calculate Running stock column in the above table , in this example we know the current on hand stock for the apple and the demand for them as per orders that should delivered on date mentioned required & incoming delivery on a certain date, the last row in the running total column will be the free stock . I hope you can help.
Hello,
I think this is basically what you want to do. Feel free to ask questions or raise concerns, if it doesn't meet your conditions:
pacman::p_load(char = c('collapse','data.table'))
# get some Dummy Data
Data <- data.table(
  ID         = c(200:204),
  Order_Type = factor(c(rep('ordered',4),'received'), levels = c('ordered','received')),
  Quantity   = c(2,3,5,2,15),
  Date       = as.IDate(c('2022-01-10','2022-02-10','2022-02-10','2022-08-10','2022-09-10'))
)

Quantity_Start <- 10L

Data |>
  # sort by ID, just to be on the safe side
  roworder(ID) |>
  fmutate(
    Running_Stock = fifelse(Order_Type == 'ordered', -Quantity, Quantity)
  ) |>
  ftransform(
    Running_Stock = Quantity_Start + fcumsum(Running_Stock)
  )
#>     ID Order_Type Quantity       Date Running_Stock
#> 1: 200    ordered        2 2022-01-10             8
#> 2: 201    ordered        3 2022-02-10             5
#> 3: 202    ordered        5 2022-02-10             0
#> 4: 203    ordered        2 2022-08-10            -2
#> 5: 204   received       15 2022-09-10            13
Created on 2022-09-28 with reprex v2.0.2
Kind regards
1 Like
Hi,
Thanks a lot ....it is exactly what i need , it was really quick
This topic was automatically closed 7 days after the last reply. New replies are no longer allowed.
If you have a query related to it or one of the replies, start a new topic and refer back with a link.