How to create a multiple bar plot out of a m*n matrix

I would like to create a multiple bar plot out of a data frame that has an mn matrix structure. This will have a total of mn cells such that each cell will have a bar-plot of its equivalent value.

MN matrices are called incidence matrices as opposed to MM matrices which are called adjacency matrices.

I found out the way of plotting this for data frame with adjacency matrix (mm) matrix structure using igrpah package in R. However, I could not figure out vertices metadata for incidence (mn) matrix structure.
Could you please create a multiple bar plot for this type of data frame in R.
Provided below is an imaginary data frame of the number of tourists visiting 5 different countries for 12 months.

set.seed(19881003)
Australia <- (runif(12,0,1))
France <- (runif(12, 0,1) + Australia)
UnitedKingdom <- rbinom(12,2, 0.6)
USA <- rpois(12,0.06)+UnitedKingdom
Italy <- UnitedKingdom+USA+0.012
months <- c("Jan", "Feb", "Mar", "Apr", "May", "Jun", "Jul", "Aug", "Sep", "Oct", "Nov", "Dec")
#
tourist.data <- data.frame(months, Australia, France, UnitedKingdom, USA, Italy)

I have also attached a sample chart. This chart differs from what I want in that the x-axis should represent 12 months instead of the countries
Is this close enough?

library(ggplot2)
library(tidyr)
library(dplyr)
#> 
#> Attaching package: 'dplyr'
#> The following objects are masked from 'package:stats':
#> 
#>     filter, lag
#> The following objects are masked from 'package:base':
#> 
#>     intersect, setdiff, setequal, union
set.seed(19881003)
Australia <- (runif(12,0,1))
France <- (runif(12, 0,1) + Australia)
UnitedKingdom <- rbinom(12,2, 0.6)
USA <- rpois(12,0.06)+UnitedKingdom
Italy <- UnitedKingdom+USA+0.012
months <- c("Jan", "Feb", "Mar", "Apr", "May", "Jun", "Jul", "Aug", "Sep", "Oct", "Nov", "Dec")
#
tourist.data <- data.frame(months, Australia, France, UnitedKingdom, USA, Italy)
  
tourist.data |> mutate(months=factor(months,levels = month.abb)) |> 
  pivot_longer(cols = -months) |>  
  ggplot(aes(months,value)) + geom_col() +
  facet_grid(name~months, scales = "free_x")

Created on 2024-02-28 with reprex v2.0.2

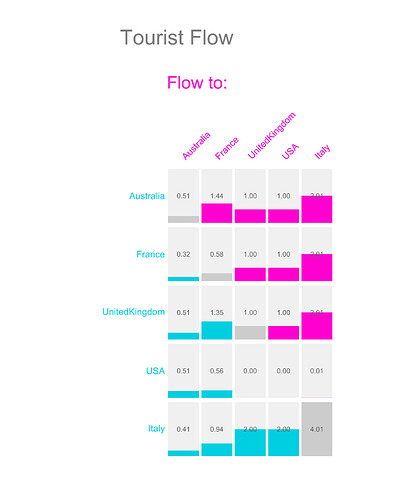
Thank you. It is close enough. Could you think of it as a network plot or a heatmap plot? In case of adjacency matrix where the rows and columns are the same, I found out the way . Can you or anybody help me to plot country versus month plot in a way somewhat similar to the following country versus country plot:

set.seed(19881003)
Australia <- (runif(5,0,1))
France <- (runif(5, 0,1) + Australia)
UnitedKingdom <- rbinom(5,2, 0.6)
USA <- rpois(5,0.06)+UnitedKingdom
Italy <- UnitedKingdom+USA+0.012
country <- c("Australia", "France", "UnitedKingdom", "USA", "Italy")
touristflow <- data.frame(country, Australia, France, UnitedKingdom, USA, Italy)

library(tidyr)
main_data<- pivot_longer(touristflow,cols=c("Australia", "France", "UnitedKingdom", "USA","Italy"),
                   names_to = "dest_country", values_to = "tourist_flow (in millions)")
## Also prepare a dataframe of vertices and other attributes
support_data<- data.frame(region = 
                     c("Australia",
                       "France",
                       "UnitedKingdom",
                       "USA", "Italy"),
                 order1 = c(3,2,1,4,5)
                          )

## prepare for chart
svg_file <- "multiplebarplot.svg"
svg(svg_file, width=8, height=10)

library(igraph)
library(RColorBrewer)
## 
## prepare data
flowdat <- graph_from_data_frame(d=main_data, vertices = support_data,
                                 directed = TRUE)
flowdat_mat <- get.adjacency(flowdat, attr = "tourist_flow (in millions)", sparse = FALSE) 
maxmvalue <- max(flowdat_mat)
n <- nrow(flowdat_mat)
m <- n
##
par(mfrow = c(n,m), omi = c(1,4,4,2), mai=c(0,0,0,0))
color1 <- rgb(255,0,210, maxColorValue = 255)
color2 <- rgb(0,208,226, maxColorValue = 255)

## chart
for (i in 1:n) {
    for (j in 1:m) {
        plot (1:1, xlim= c(0,1), ylim = c(0,1), type = "n", axes = FALSE)
        if (i<j) mycolor <- color1
        if (i==j) mycolor <- "grey80"
        if (i>j) mycolor <- color2
        if(i==1) text(0.5, 1.2,support_data$region[j],
                      cex=2, xpd=NA, adj=0, srt=45,col=color1)
        if(j==1) text(-0.1, 0.5, support_data$region[i],
                      cex=2, xpd=NA, adj=1, col=color2)
        rect(0,0,1,1, col="grey95", border=NA)
        rect(0,0,1,flowdat_mat[i,j]/maxmvalue, col=mycolor,
             border=NA)
        text(0.5,0.5,format(round(flowdat_mat[i,j],2), nsmall=2), cex=1.5,
             col="grey40")
       
    }
}
mtext("Flow to:",side=3, outer = TRUE, cex=2.5, line=14, col=mycolor1, adj=0)
mtext("Tourist Flow (in millions)", side=3, outer = TRUE, cex=3, adj=1, at=0.4, line = 22, col="grey50", family="Lato Black")

dev.off()

Hi. Thank you for your help
I was just wondering if I could reorder the countries according to my choice. For instance I would like to place Italy first followed by France, Australia, USA and finally UnitedKingdom.
Any help is much appreciated

You can set the order of the countries using the factor() function.

library(ggplot2)
library(tidyr)
library(dplyr)
#> 
#> Attaching package: 'dplyr'
#> The following objects are masked from 'package:stats':
#> 
#>     filter, lag
#> The following objects are masked from 'package:base':
#> 
#>     intersect, setdiff, setequal, union

set.seed(19881003)
Australia <- (runif(12,0,1))
France <- (runif(12, 0,1) + Australia)
UnitedKingdom <- rbinom(12,2, 0.6)
USA <- rpois(12,0.06)+UnitedKingdom
Italy <- UnitedKingdom+USA+0.012
months <- c("Jan", "Feb", "Mar", "Apr", "May", "Jun", "Jul", "Aug", "Sep", "Oct", "Nov", "Dec")
#
tourist.data <- data.frame(months, Australia, France, UnitedKingdom, USA, Italy)

tourist.data |> mutate(months=factor(months,levels = month.abb)) |> 
  pivot_longer(cols = -months) |>
  mutate(name = factor(name, levels = c("Italy", "France", "Australia", "USA", "UnitedKingdom"))) |> 
  ggplot(aes(months,value)) + geom_col() +
  facet_grid(name~months, scales = "free_x")

Created on 2024-03-31 with reprex v2.0.2

This topic was automatically closed 7 days after the last reply. New replies are no longer allowed.

If you have a query related to it or one of the replies, start a new topic and refer back with a link.